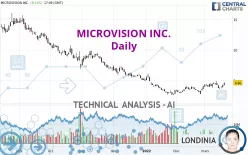
MICROVISION INC. - Daily - Technical analysis published on 03/18/2022 (GMT)
- 322
- 0
Click here for a new analysis!
- Timeframe : Daily
- - Analysis generated on
- Status : INVALID

Summary of the analysis

Additional analysis
Quotes
The MICROVISION INC. price is 4.67 USD. The price registered an increase of +9.37% on the session with the lowest point at 4.23 USD and the highest point at 4.69 USD. The deviation from the price is +10.40% for the low point and -0.43% for the high point.The Central Gaps scanner detects a bearish opening marking the presence of sellers ahead of buyers at the opening but not sufficiently marked to allow the price to register a quotation gap.
Bearish opening
Type : Bearish
Timeframe : Openning
A study of price movements over other periods shows the following variations:
Technical
A technical analysis in Daily of this MICROVISION INC. chart shows a slightly bearish trend. 53.57% of the signals given by moving averages are bearish. Caution: the strong bullish signals currently being given by short-term moving averages could quickly lead to a reversal of the trend. The Central Indicators market scanner is currently detecting a bullish signal that could impact this trend:
Bullish trend reversal : adaptative moving average 20
Type : Bullish
Timeframe : Daily
In fact, 13 technical indicators on 18 studied are currently positioned bullish. Central Indicators, the detector scanner for these technical indicators has recently detected several signals:
Pivot points : price is over resistance 2
Type : Neutral
Timeframe : Daily
Price is back over the pivot point
Type : Bullish
Timeframe : Weekly
Momentum indicator is back over 0
Type : Bullish
Timeframe : Daily
Central Patterns, the scanner specializing in chart patterns, did not identify any signals.
The presence of a bullish Japanese candlestick pattern detected by Central Candlesticks that could cause a very short term rebound was also detected:
Three white soldiers
Type : Bullish
Timeframe : Daily
| S1 | Price | R1 | R2 | R3 | |
|---|---|---|---|---|---|
| ProTrendLines | 3.76 | 4.67 | 7.61 | 10.16 | 12.22 |
| Change (%) | -19.49% | - | +62.96% | +117.56% | +161.67% |
| Change | -0.91 | - | +2.94 | +5.49 | +7.55 |
| Level | Major | - | Minor | Intermediate | Major |
Pivot points can also be used to set your price objectives. Here is the price situation in relation to pivot points:
| Pivot points | S3 | S2 | S1 | PP | R1 | R2 | R3 |
|---|---|---|---|---|---|---|---|
| Standard | 3.60 | 3.74 | 4.01 | 4.15 | 4.42 | 4.56 | 4.83 |
| Camarilla | 4.16 | 4.20 | 4.23 | 4.27 | 4.31 | 4.35 | 4.38 |
| Woodie | 3.66 | 3.77 | 4.07 | 4.18 | 4.48 | 4.59 | 4.89 |
| Fibonacci | 3.74 | 3.90 | 4.00 | 4.15 | 4.31 | 4.41 | 4.56 |
| Pivot points | S3 | S2 | S1 | PP | R1 | R2 | R3 |
|---|---|---|---|---|---|---|---|
| Standard | 2.69 | 3.26 | 3.78 | 4.35 | 4.87 | 5.44 | 5.96 |
| Camarilla | 4.00 | 4.10 | 4.20 | 4.30 | 4.40 | 4.50 | 4.60 |
| Woodie | 2.67 | 3.25 | 3.76 | 4.34 | 4.85 | 5.43 | 5.94 |
| Fibonacci | 3.26 | 3.68 | 3.93 | 4.35 | 4.77 | 5.02 | 5.44 |
| Pivot points | S3 | S2 | S1 | PP | R1 | R2 | R3 |
|---|---|---|---|---|---|---|---|
| Standard | 1.81 | 2.32 | 3.16 | 3.67 | 4.51 | 5.02 | 5.86 |
| Camarilla | 3.64 | 3.76 | 3.89 | 4.01 | 4.13 | 4.26 | 4.38 |
| Woodie | 1.99 | 2.40 | 3.34 | 3.75 | 4.69 | 5.10 | 6.04 |
| Fibonacci | 2.32 | 2.83 | 3.15 | 3.67 | 4.18 | 4.50 | 5.02 |
Numerical data
The following is the status of the technical indicators and moving averages at the time of publication of this technical analysis:
| RSI (14): | 59.30 | |
| MACD (12,26,9): | 0.1300 | |
| Directional Movement: | 10.07 | |
| AROON (14): | -14.28 | |
| DEMA (21): | 4.22 | |
| Parabolic SAR (0,02-0,02-0,2): | 4.76 | |
| Elder Ray (13): | 0.27 | |
| Super Trend (3,10): | 3.33 | |
| Zig ZAG (10): | 4.60 | |
| VORTEX (21): | 1.0500 | |
| Stochastique (14,3,5): | 56.73 | |
| TEMA (21): | 4.45 | |
| Williams %R (14): | -24.09 | |
| Chande Momentum Oscillator (20): | 0.36 | |
| Repulse (5,40,3): | 15.9000 | |
| ROCnROLL: | 1 | |
| TRIX (15,9): | 0.4800 | |
| Courbe Coppock: | 29.44 |
| MA7: | 4.19 | |
| MA20: | 4.01 | |
| MA50: | 3.73 | |
| MA100: | 5.45 | |
| MAexp7: | 4.24 | |
| MAexp20: | 4.08 | |
| MAexp50: | 4.32 | |
| MAexp100: | 5.76 | |
| Price / MA7: | +11.46% | |
| Price / MA20: | +16.46% | |
| Price / MA50: | +25.20% | |
| Price / MA100: | -14.31% | |
| Price / MAexp7: | +10.14% | |
| Price / MAexp20: | +14.46% | |
| Price / MAexp50: | +8.10% | |
| Price / MAexp100: | -18.92% |
News
Don't forget to follow the news on MICROVISION INC.. At the time of publication of this analysis, the latest news was as follows:
- DGAP-News: MicroVision Inc.: MicroVision Announces Fourth Quarter and Full Year 2021 Results
- MicroVision Announces Fourth Quarter and Full Year 2021 Results
- MicroVision Announces Participation in Upcoming Investor Conferences
- DGAP-News: MicroVision Inc.: MicroVision to Announce Fourth Quarter and Full Year 2021 Results on February 24, 2022
- MicroVision to Announce Fourth Quarter and Full Year 2021 Results on February 24, 2022
About author

Online


Add a comment
Comments
0 comments on the analysis MICROVISION INC. - Daily