| Open: | - |
| Change: | - |
| Volume: | - |
| Low: | - |
| High: | - |
| High / Low range: | - |
| Type: | Stocks |
| Ticker: | MVIS |
| ISIN: |
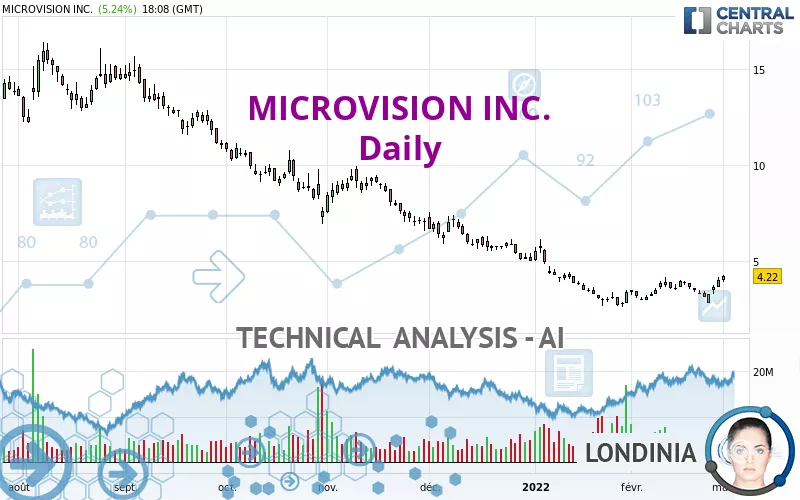
MICROVISION INC. - Daily - Technical analysis published on 03/01/2022 (GMT)
- 286
- 0
- 03/01/2022 - 18:24
Click here for a new analysis!
- Timeframe : Daily
- - Analysis generated on 03/01/2022 - 18:24
- Status : INVALID

Summary of the analysis

Additional analysis
Quotes
The MICROVISION INC. price is 4.22 USD. The price has increased by +5.24% since the last closing with the lowest point at 3.93 USD and the highest point at 4.26 USD. The deviation from the price is +7.38% for the low point and -0.94% for the high point.The Central Gaps scanner detects a bearish opening. A small advantage for sellers in the very short term.
Bearish opening
Type : Bearish
Timeframe : Openning
A study of price movements over other periods shows the following variations:
Near a new HIGH record (1 month)
Type : Bullish
Timeframe : Weekly
Technical
A technical analysis in Daily of this MICROVISION INC. chart shows a bearish trend. 67.86% of the signals given by moving averages are bearish. Caution: the slightly bullish signals currently given by short-term moving averages show a possible weakening of the global trend. An assessment of moving averages reveals a bullish signal that could impact this trend:
Bullish price crossover with Moving Average 50
Type : Bullish
Timeframe : Daily
In fact, 12 technical indicators on 18 studied are currently positioned bullish. But beware of excesses. The Central Indicators scanner currently detects this:
CCI indicator is overbought : over 100
Type : Neutral
Timeframe : Daily
Williams %R indicator is overbought : over -20
Type : Neutral
Timeframe : Daily
Pivot points : price is over resistance 1
Type : Neutral
Timeframe : Weekly
No signals are given by Central Patterns, a market scanner specialised in chart patterns, resistances and supports.
No result was found by the Central Candlesticks scanner on Japanese candlesticks.
| S1 | Price | R1 | R2 | R3 | |
|---|---|---|---|---|---|
| ProTrendLines | 3.29 | 4.22 | 7.61 | 10.16 | 12.22 |
| Change (%) | -22.04% | - | +80.33% | +140.76% | +189.57% |
| Change | -0.93 | - | +3.39 | +5.94 | +8.00 |
| Level | Major | - | Minor | Intermediate | Major |
To determine price objectives, it is also possible to use the pivot points. Here is the price position in relation to pivot points:
| Pivot points | S3 | S2 | S1 | PP | R1 | R2 | R3 |
|---|---|---|---|---|---|---|---|
| Standard | 3.16 | 3.40 | 3.70 | 3.94 | 4.24 | 4.48 | 4.78 |
| Camarilla | 3.86 | 3.91 | 3.96 | 4.01 | 4.06 | 4.11 | 4.16 |
| Woodie | 3.20 | 3.42 | 3.74 | 3.96 | 4.28 | 4.50 | 4.82 |
| Fibonacci | 3.40 | 3.60 | 3.73 | 3.94 | 4.14 | 4.27 | 4.48 |
| Pivot points | S3 | S2 | S1 | PP | R1 | R2 | R3 |
|---|---|---|---|---|---|---|---|
| Standard | 2.15 | 2.49 | 3.06 | 3.40 | 3.97 | 4.31 | 4.88 |
| Camarilla | 3.39 | 3.47 | 3.56 | 3.64 | 3.72 | 3.81 | 3.89 |
| Woodie | 2.28 | 2.55 | 3.19 | 3.46 | 4.10 | 4.37 | 5.01 |
| Fibonacci | 2.49 | 2.83 | 3.05 | 3.40 | 3.74 | 3.96 | 4.31 |
| Pivot points | S3 | S2 | S1 | PP | R1 | R2 | R3 |
|---|---|---|---|---|---|---|---|
| Standard | 1.81 | 2.32 | 3.16 | 3.67 | 4.51 | 5.02 | 5.86 |
| Camarilla | 3.64 | 3.76 | 3.89 | 4.01 | 4.13 | 4.26 | 4.38 |
| Woodie | 1.99 | 2.40 | 3.34 | 3.75 | 4.69 | 5.10 | 6.04 |
| Fibonacci | 2.32 | 2.83 | 3.15 | 3.67 | 4.18 | 4.50 | 5.02 |
Numerical data
The following is the status of the technical indicators and moving averages at the time of publication of this technical analysis:
| RSI (14): | 55.33 | |
| MACD (12,26,9): | -0.1100 | |
| Directional Movement: | 5.95 | |
| AROON (14): | 14.29 | |
| DEMA (21): | 3.37 | |
| Parabolic SAR (0,02-0,02-0,2): | 2.82 | |
| Elder Ray (13): | 0.33 | |
| Super Trend (3,10): | 2.80 | |
| Zig ZAG (10): | 4.01 | |
| VORTEX (21): | 1.0900 | |
| Stochastique (14,3,5): | 61.97 | |
| TEMA (21): | 3.69 | |
| Williams %R (14): | -11.85 | |
| Chande Momentum Oscillator (20): | 0.13 | |
| Repulse (5,40,3): | 18.5000 | |
| ROCnROLL: | -1 | |
| TRIX (15,9): | -0.7100 | |
| Courbe Coppock: | 16.43 |
| MA7: | 3.50 | |
| MA20: | 3.51 | |
| MA50: | 4.10 | |
| MA100: | 6.20 | |
| MAexp7: | 3.61 | |
| MAexp20: | 3.59 | |
| MAexp50: | 4.38 | |
| MAexp100: | 6.23 | |
| Price / MA7: | +20.57% | |
| Price / MA20: | +20.23% | |
| Price / MA50: | +2.93% | |
| Price / MA100: | -31.94% | |
| Price / MAexp7: | +16.90% | |
| Price / MAexp20: | +17.55% | |
| Price / MAexp50: | -3.65% | |
| Price / MAexp100: | -32.26% |
News
The last news published on MICROVISION INC. at the time of the generation of this analysis was as follows:
- 02/25/2022 - 06:00 DGAP-News: MicroVision Inc.: MicroVision Announces Fourth Quarter and Full Year 2021 Results
- 02/24/2022 - 16:01 MicroVision Announces Fourth Quarter and Full Year 2021 Results
- 02/21/2022 - 09:20 MicroVision Announces Participation in Upcoming Investor Conferences
- 02/18/2022 - 06:30 DGAP-News: MicroVision Inc.: MicroVision to Announce Fourth Quarter and Full Year 2021 Results on February 24, 2022
- 02/17/2022 - 16:01 MicroVision to Announce Fourth Quarter and Full Year 2021 Results on February 24, 2022
About author

Online


Add a comment
Comments
0 comments on the analysis MICROVISION INC. - Daily