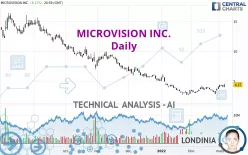
MICROVISION INC. - Daily - Technical analysis published on 03/06/2022 (GMT)
- 309
- 0
Click here for a new analysis!
- Timeframe : Daily
- - Analysis generated on
- Status : INVALID

Summary of the analysis

Additional analysis
Quotes
The MICROVISION INC. price is 4.37 USD. The price registered an increase of +8.17% on the session and was traded between 3.96 USD and 4.51 USD over the period. The price is currently at +10.35% from its lowest and -3.10% from its highest.The Central Gaps scanner detects the formation of a bearish gap marking the strong presence of sellers ahead of buyers at the opening. This formed a quotation gap.
Opening Gap DOWN
Type : Bearish
Timeframe : Openning
So that you have an overall view of the price change, here is a table showing the variations over several periods:
New HIGH record (1 month)
Type : Bullish
Timeframe : Weekly
Technical
Technical analysis of this Daily chart of MICROVISION INC. indicates that the overall trend is slightly bearish. 57.14% of the signals given by moving averages are bearish. Caution: the strong bullish signals currently being given by short-term moving averages could quickly lead to a reversal of the trend. There is no crossing of moving average by the price or crossing of moving averages between themselves.
Technical indicators are strongly bullish, suggesting that the price increase should continue.
But beware of excesses. The Central Indicators scanner currently detects this:
CCI indicator is overbought : over 100
Type : Neutral
Timeframe : Daily
Williams %R indicator is overbought : over -20
Type : Neutral
Timeframe : Daily
Pivot points : price is over resistance 1
Type : Neutral
Timeframe : Daily
Pivot points : price is over resistance 2
Type : Neutral
Timeframe : Weekly
The analysis of the price chart with Central Patterns scanners does not return any result.
The presence of a bullish Japanese candlestick pattern detected by Central Candlesticks that could cause a very short term rebound was also detected:
Bullish engulfing lines
Type : Bullish
Timeframe : Daily
| S1 | Price | R1 | R2 | R3 | |
|---|---|---|---|---|---|
| ProTrendLines | 3.76 | 4.37 | 7.61 | 10.16 | 12.22 |
| Change (%) | -13.96% | - | +74.14% | +132.49% | +179.63% |
| Change | -0.61 | - | +3.24 | +5.79 | +7.85 |
| Level | Major | - | Minor | Major | Intermediate |
To determine price objectives, it is also possible to use the pivot points. Here is the price position in relation to pivot points:
| Pivot points | S3 | S2 | S1 | PP | R1 | R2 | R3 |
|---|---|---|---|---|---|---|---|
| Standard | 3.50 | 3.73 | 4.05 | 4.28 | 4.60 | 4.83 | 5.15 |
| Camarilla | 4.22 | 4.27 | 4.32 | 4.37 | 4.42 | 4.47 | 4.52 |
| Woodie | 3.55 | 3.75 | 4.10 | 4.30 | 4.65 | 4.85 | 5.20 |
| Fibonacci | 3.73 | 3.94 | 4.07 | 4.28 | 4.49 | 4.62 | 4.83 |
| Pivot points | S3 | S2 | S1 | PP | R1 | R2 | R3 |
|---|---|---|---|---|---|---|---|
| Standard | 2.95 | 3.29 | 3.83 | 4.17 | 4.71 | 5.05 | 5.59 |
| Camarilla | 4.13 | 4.21 | 4.29 | 4.37 | 4.45 | 4.53 | 4.61 |
| Woodie | 3.05 | 3.34 | 3.93 | 4.22 | 4.81 | 5.10 | 5.69 |
| Fibonacci | 3.29 | 3.63 | 3.83 | 4.17 | 4.51 | 4.71 | 5.05 |
| Pivot points | S3 | S2 | S1 | PP | R1 | R2 | R3 |
|---|---|---|---|---|---|---|---|
| Standard | 1.81 | 2.32 | 3.16 | 3.67 | 4.51 | 5.02 | 5.86 |
| Camarilla | 3.64 | 3.76 | 3.89 | 4.01 | 4.13 | 4.26 | 4.38 |
| Woodie | 1.99 | 2.40 | 3.34 | 3.75 | 4.69 | 5.10 | 6.04 |
| Fibonacci | 2.32 | 2.83 | 3.15 | 3.67 | 4.18 | 4.50 | 5.02 |
Numerical data
The following is the status of the technical indicators and moving averages at the time of publication of this technical analysis:
| RSI (14): | 59.07 | |
| MACD (12,26,9): | 0.0700 | |
| Directional Movement: | 9.07 | |
| AROON (14): | 42.86 | |
| DEMA (21): | 3.80 | |
| Parabolic SAR (0,02-0,02-0,2): | 3.02 | |
| Elder Ray (13): | 0.36 | |
| Super Trend (3,10): | 3.14 | |
| Zig ZAG (10): | 4.37 | |
| VORTEX (21): | 1.0800 | |
| Stochastique (14,3,5): | 87.41 | |
| TEMA (21): | 4.20 | |
| Williams %R (14): | -8.55 | |
| Chande Momentum Oscillator (20): | 0.39 | |
| Repulse (5,40,3): | 11.7400 | |
| ROCnROLL: | -1 | |
| TRIX (15,9): | -0.2100 | |
| Courbe Coppock: | 20.61 |
| MA7: | 3.99 | |
| MA20: | 3.71 | |
| MA50: | 3.97 | |
| MA100: | 5.97 | |
| MAexp7: | 4.04 | |
| MAexp20: | 3.81 | |
| MAexp50: | 4.36 | |
| MAexp100: | 6.08 | |
| Price / MA7: | +9.52% | |
| Price / MA20: | +17.79% | |
| Price / MA50: | +10.08% | |
| Price / MA100: | -26.80% | |
| Price / MAexp7: | +8.17% | |
| Price / MAexp20: | +14.70% | |
| Price / MAexp50: | +0.23% | |
| Price / MAexp100: | -28.13% |
News
Don't forget to follow the news on MICROVISION INC.. At the time of publication of this analysis, the latest news was as follows:
- DGAP-News: MicroVision Inc.: MicroVision Announces Fourth Quarter and Full Year 2021 Results
- MicroVision Announces Fourth Quarter and Full Year 2021 Results
- MicroVision Announces Participation in Upcoming Investor Conferences
- DGAP-News: MicroVision Inc.: MicroVision to Announce Fourth Quarter and Full Year 2021 Results on February 24, 2022
- MicroVision to Announce Fourth Quarter and Full Year 2021 Results on February 24, 2022
About author

Online


Add a comment
Comments
0 comments on the analysis MICROVISION INC. - Daily