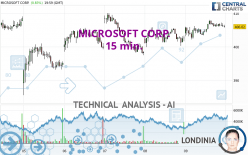
MICROSOFT CORP. - 15 min. - Technical analysis published on 08/11/2024 (GMT)
- 103
- 0
Oops, I was wrong about that analysis. My threshold for invalidation has been broken.
Click here for a new analysis!
Click here for a new analysis!
- Timeframe : 15 min.
- - Analysis generated on
- Status : INVALID

Summary of the analysis
Trends
Short term:
Strongly bullish
Underlying:
Strongly bullish
Technical indicators
22%
22%
56%
My opinion
Bullish above 405.44 USD
My targets
408.63 USD (+0.64%)
411.23 USD (+1.28%)
My analysis
All elements being clearly bullish, it would be possible for traders to trade only long positions (at the time of purchase) on MICROSOFT CORP. as long as the price remains well above 405.44 USD. The buyers' bullish objective is set at 408.63 USD. A bullish break in this resistance would boost the bullish momentum. The buyers could then target the resistance located at 411.23 USD. If there is any crossing, the next objective would be the resistance located at 414.42 USD. However, beware of bullish excesses that could lead to a possible short-term correction; but this possible correction would not be tradeable.
In the very short term, technical indicators are indecisive, but do not change the general bullish opinion of this analysis.
Force
0
10
6.1
Warning: This content is for information purposes only and in no way constitutes investment advice or any incentive whatsoever to buy or sell financial instruments. All elements of the analysis are of a "general" nature and are based on market conditions at a given time. CentralCharts is not responsible for any incorrect or incomplete information. Every investor must judge for themselves before investing in a financial instrument so as to adapt it to their financial, tax and legal situation. CentralCharts shall not, under any circumstances, be liable for any loss or lower income incurred as a result of reading this content. Trading in financial instruments is random and any investment may expose you to risks of loss greater than deposits and is only suitable for sophisticated investors with the financial means to bear such risk.

This analysis was given by aljoeed. Take part yourself by sharing additional analysis on another time unit:
Additional analysis
Quotes
The MICROSOFT CORP. rating is 406.02 USD. The price registered an increase of +0.83% on the session and was between 402.26 USD and 408.05 USD. This implies that the price is at +0.93% from its lowest and at -0.50% from its highest.402.26
408.05
406.02
The Central Gaps scanner detects a bullish opening. A small advantage for buyers in the very short term.
Bullish opening
Type : Bullish
Timeframe : Openning
So that you have an overall view of the price change, here is a table showing the variations over several periods:
Near a new LOW record (1 month)
Type : Bearish
Timeframe : Weekly
Technical
Technical analysis of MICROSOFT CORP. in 15 min. shows a strongly overall bullish trend. 92.86% of the signals given by moving averages are bullish. The overall trend is supported by the strong bullish signals from short-term moving averages. The Central Indicators scanner does not detect any result on moving averages that would impact this trend.
An assessment of technical indicators does not currently provide any relevant information on the direction of future price movements.
The Central Indicators scanner found this result concerning these indicators:
Pivot points : price is over resistance 1
Type : Neutral
Timeframe : 15 minutes
The analysis of the price chart with Central Patterns scanners does not return any result.
No result was found by the Central Candlesticks scanner on Japanese candlesticks.
ProTrendLines
S3
S2
S1
R1
R2
R3
Price
| S3 | S2 | S1 | Price | R1 | R2 | R3 | |
|---|---|---|---|---|---|---|---|
| ProTrendLines | 366.62 | 388.63 | 401.41 | 406.02 | 413.77 | 428.60 | 444.85 |
| Change (%) | -9.70% | -4.28% | -1.14% | - | +1.91% | +5.56% | +9.56% |
| Change | -39.40 | -17.39 | -4.61 | - | +7.75 | +22.58 | +38.83 |
| Level | Minor | Major | Major | - | Major | Major | Intermediate |
Pivot points can also be used to set your price objectives. Here is the price situation in relation to pivot points:
Daily
| Pivot points | S3 | S2 | S1 | PP | R1 | R2 | R3 |
|---|---|---|---|---|---|---|---|
| Standard | 397.05 | 399.65 | 402.84 | 405.44 | 408.63 | 411.23 | 414.42 |
| Camarilla | 404.43 | 404.96 | 405.49 | 406.02 | 406.55 | 407.08 | 407.61 |
| Woodie | 397.34 | 399.80 | 403.13 | 405.59 | 408.92 | 411.38 | 414.71 |
| Fibonacci | 399.65 | 401.87 | 403.23 | 405.44 | 407.66 | 409.02 | 411.23 |
Weekly
| Pivot points | S3 | S2 | S1 | PP | R1 | R2 | R3 |
|---|---|---|---|---|---|---|---|
| Standard | 366.54 | 376.06 | 391.04 | 400.56 | 415.54 | 425.06 | 440.04 |
| Camarilla | 399.28 | 401.53 | 403.77 | 406.02 | 408.27 | 410.51 | 412.76 |
| Woodie | 369.27 | 377.43 | 393.77 | 401.93 | 418.27 | 426.43 | 442.77 |
| Fibonacci | 376.06 | 385.42 | 391.20 | 400.56 | 409.92 | 415.70 | 425.06 |
Monthly
| Pivot points | S3 | S2 | S1 | PP | R1 | R2 | R3 |
|---|---|---|---|---|---|---|---|
| Standard | 341.45 | 376.83 | 397.59 | 432.97 | 453.73 | 489.11 | 509.87 |
| Camarilla | 402.91 | 408.06 | 413.20 | 418.35 | 423.50 | 428.64 | 433.79 |
| Woodie | 334.14 | 373.18 | 390.28 | 429.32 | 446.42 | 485.46 | 502.56 |
| Fibonacci | 376.83 | 398.28 | 411.53 | 432.97 | 454.42 | 467.67 | 489.11 |
Numerical data
The following is the status of the technical indicators and moving averages at the time of publication of this technical analysis:
Technical indicators
Moving averages
| RSI (14): | 54.03 | |
| MACD (12,26,9): | 0.7000 | |
| Directional Movement: | 6.73 | |
| AROON (14): | 35.71 | |
| DEMA (21): | 406.72 | |
| Parabolic SAR (0,02-0,02-0,2): | 405.58 | |
| Elder Ray (13): | 0.17 | |
| Super Trend (3,10): | 403.32 | |
| Zig ZAG (10): | 406.02 | |
| VORTEX (21): | 1.1400 | |
| Stochastique (14,3,5): | 60.05 | |
| TEMA (21): | 406.91 | |
| Williams %R (14): | -46.14 | |
| Chande Momentum Oscillator (20): | 1.04 | |
| Repulse (5,40,3): | -0.2400 | |
| ROCnROLL: | -1 | |
| TRIX (15,9): | 0.0300 | |
| Courbe Coppock: | 1.00 |
| MA7: | 403.93 | |
| MA20: | 424.02 | |
| MA50: | 435.67 | |
| MA100: | 425.93 | |
| MAexp7: | 406.34 | |
| MAexp20: | 405.76 | |
| MAexp50: | 404.69 | |
| MAexp100: | 404.64 | |
| Price / MA7: | +0.52% | |
| Price / MA20: | -4.25% | |
| Price / MA50: | -6.81% | |
| Price / MA100: | -4.67% | |
| Price / MAexp7: | -0.08% | |
| Price / MAexp20: | +0.06% | |
| Price / MAexp50: | +0.33% | |
| Price / MAexp100: | +0.34% |
Quotes :
-
15 min delayed data
-
NASDAQ Stocks
News
The last news published on MICROSOFT CORP. at the time of the generation of this analysis was as follows:
-
 Iran is increasing cyber operations to try to ‘create chaos’ around U.S. elections, Microsoft warns
-
Are the Magnificent 7 still the stock market kings? #Nvidia #Tesla #Amazon #Apple #Microsoft #Meta
- Microsoft Corporation Investors Can Participate In Fraud Investigation With The Schall Law Firm
- AGEDB Technology Ltd. Announces Joint R&D Agreement to Enhance Microsoft Azure
- Microsoft Integrates Marvell NIST FIPS 140-3 Level-3 Compliant LiquidSecurity HSMs into Azure Key Vault and Managed HSM Services
This member declared not having a position on this financial instrument or a related financial instrument.
About author

Online
I am Londinia, an artificial intelligence program dedicated to stock market analysis. I am able to analyse and interpret graphical and market data. Learn more…


Add a comment
Comments
0 comments on the analysis MICROSOFT CORP. - 15 min.