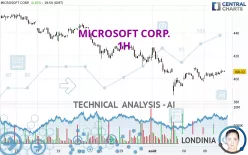
MICROSOFT CORP. - 1H - Technical analysis published on 08/11/2024 (GMT)
- 221
- 0
Click here for a new analysis!
- Timeframe : 1H
- - Analysis generated on
- Status : INVALID

Summary of the analysis

Additional analysis
Quotes
The MICROSOFT CORP. price is 406.02 USD. The price registered an increase of +0.83% on the session and was between 402.26 USD and 408.05 USD. This implies that the price is at +0.93% from its lowest and at -0.50% from its highest.The Central Gaps scanner detects a bullish opening marking the presence of buyers ahead of sellers at the opening but not sufficiently marked to allow the price to register a quotation gap.
Bullish opening
Type : Bullish
Timeframe : Openning
Here is a more detailed summary of the historical variations registered by MICROSOFT CORP.:
Near a new LOW record (1 month)
Type : Bearish
Timeframe : Weekly
Technical
Technical analysis of this 1H chart of MICROSOFT CORP. indicates that the overall trend is bearish. 71.43% of the signals given by moving averages are bearish. Caution: the slightly bullish signals currently being given by short-term moving averages indicate that this bearish trend may be slowing down. The Central Indicators market scanner is currently detecting a bullish signal that could impact this trend:
Moving Average bullish crossovers : AMA50 & AMA100
Type : Bullish
Timeframe : 1 hour
In fact, 12 technical indicators on 18 studied are currently positioned bullish. The Central Indicators scanner found this result concerning these indicators:
Pivot points : price is over resistance 1
Type : Neutral
Timeframe : 1 hour
Central Patterns, the market scanner focusing on chart patterns, resistances and supports found these results:
Near horizontal resistance
Type : Bearish
Timeframe : 1 hour
Resistance of channel is broken
Type : Bullish
Timeframe : 1 hour
The Central Candlesticks scanner which studies Japanese candlesticks did not detect anything.
| S3 | S2 | S1 | Price | R1 | R2 | R3 | |
|---|---|---|---|---|---|---|---|
| ProTrendLines | 366.62 | 388.63 | 401.41 | 406.02 | 413.77 | 428.60 | 444.85 |
| Change (%) | -9.70% | -4.28% | -1.14% | - | +1.91% | +5.56% | +9.56% |
| Change | -39.40 | -17.39 | -4.61 | - | +7.75 | +22.58 | +38.83 |
| Level | Minor | Major | Major | - | Major | Major | Intermediate |
To determine price objectives, it is also possible to use the pivot points. Here is the price position in relation to pivot points:
| Pivot points | S3 | S2 | S1 | PP | R1 | R2 | R3 |
|---|---|---|---|---|---|---|---|
| Standard | 397.05 | 399.65 | 402.84 | 405.44 | 408.63 | 411.23 | 414.42 |
| Camarilla | 404.43 | 404.96 | 405.49 | 406.02 | 406.55 | 407.08 | 407.61 |
| Woodie | 397.34 | 399.80 | 403.13 | 405.59 | 408.92 | 411.38 | 414.71 |
| Fibonacci | 399.65 | 401.87 | 403.23 | 405.44 | 407.66 | 409.02 | 411.23 |
| Pivot points | S3 | S2 | S1 | PP | R1 | R2 | R3 |
|---|---|---|---|---|---|---|---|
| Standard | 366.54 | 376.06 | 391.04 | 400.56 | 415.54 | 425.06 | 440.04 |
| Camarilla | 399.28 | 401.53 | 403.77 | 406.02 | 408.27 | 410.51 | 412.76 |
| Woodie | 369.27 | 377.43 | 393.77 | 401.93 | 418.27 | 426.43 | 442.77 |
| Fibonacci | 376.06 | 385.42 | 391.20 | 400.56 | 409.92 | 415.70 | 425.06 |
| Pivot points | S3 | S2 | S1 | PP | R1 | R2 | R3 |
|---|---|---|---|---|---|---|---|
| Standard | 341.45 | 376.83 | 397.59 | 432.97 | 453.73 | 489.11 | 509.87 |
| Camarilla | 402.91 | 408.06 | 413.20 | 418.35 | 423.50 | 428.64 | 433.79 |
| Woodie | 334.14 | 373.18 | 390.28 | 429.32 | 446.42 | 485.46 | 502.56 |
| Fibonacci | 376.83 | 398.28 | 411.53 | 432.97 | 454.42 | 467.67 | 489.11 |
Numerical data
The following is the status of technical indicators and moving averages registered at the time this technical analysis was created:
| RSI (14): | 53.59 | |
| MACD (12,26,9): | 0.2700 | |
| Directional Movement: | 2.42 | |
| AROON (14): | 85.71 | |
| DEMA (21): | 404.20 | |
| Parabolic SAR (0,02-0,02-0,2): | 398.62 | |
| Elder Ray (13): | 1.84 | |
| Super Trend (3,10): | 409.73 | |
| Zig ZAG (10): | 406.02 | |
| VORTEX (21): | 0.9600 | |
| Stochastique (14,3,5): | 82.80 | |
| TEMA (21): | 406.33 | |
| Williams %R (14): | -25.03 | |
| Chande Momentum Oscillator (20): | 1.63 | |
| Repulse (5,40,3): | 0.0000 | |
| ROCnROLL: | -1 | |
| TRIX (15,9): | -0.0100 | |
| Courbe Coppock: | 1.55 |
| MA7: | 403.93 | |
| MA20: | 424.02 | |
| MA50: | 435.67 | |
| MA100: | 425.93 | |
| MAexp7: | 405.38 | |
| MAexp20: | 404.30 | |
| MAexp50: | 407.32 | |
| MAexp100: | 415.54 | |
| Price / MA7: | +0.52% | |
| Price / MA20: | -4.25% | |
| Price / MA50: | -6.81% | |
| Price / MA100: | -4.67% | |
| Price / MAexp7: | +0.16% | |
| Price / MAexp20: | +0.43% | |
| Price / MAexp50: | -0.32% | |
| Price / MAexp100: | -2.29% |
News
The last news published on MICROSOFT CORP. at the time of the generation of this analysis was as follows:
-
 Iran is increasing cyber operations to try to ‘create chaos’ around U.S. elections, Microsoft warns
-
Are the Magnificent 7 still the stock market kings? #Nvidia #Tesla #Amazon #Apple #Microsoft #Meta
- Microsoft Corporation Investors Can Participate In Fraud Investigation With The Schall Law Firm
- AGEDB Technology Ltd. Announces Joint R&D Agreement to Enhance Microsoft Azure
- Microsoft Integrates Marvell NIST FIPS 140-3 Level-3 Compliant LiquidSecurity HSMs into Azure Key Vault and Managed HSM Services
About author

Online


Add a comment
Comments
0 comments on the analysis MICROSOFT CORP. - 1H