MICROSOFT CORP. - Weekly - Technical analysis published on 01/31/2025 (GMT)
- 83
- 0
- Timeframe : Weekly
- - Analysis generated on
- Status : IN PROGRESS...
Summary of the analysis

Additional analysis
Quotes
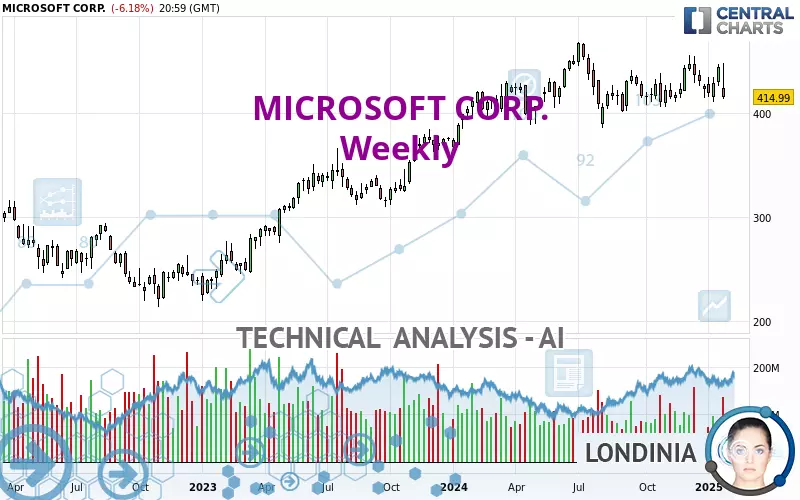
The MICROSOFT CORP. price is 414.99 USD. The price registered a decrease of -7.10% over 5 days and was traded between 413.16 USD and 448.38 USD over the period. The price is currently at +0.44% from its lowest point and -7.45% from its highest point.The Central Gaps scanner detects the formation of a bearish gap marking the strong presence of sellers ahead of buyers at the opening. This formed a quotation gap.
Opening Gap DOWN
Type : Bearish
Timeframe : Openning
So that you have an overall view of the price change, here is a table showing the variations over several periods:
Near a new HIGH record (5 years)
Type : Bullish
Timeframe : Weekly
Near a new LOW record (1st january)
Type : Bearish
Timeframe : Weekly
Near a new LOW record (1 month)
Type : Bearish
Timeframe : Weekly
Technical
A technical analysis in Weekly of this MICROSOFT CORP. chart shows a bullish trend. The signals given by moving averages are 67.86% bullish. This bullish trend could slow down given the slightly bearish signals currently being given by short-term moving averages. An assessment of moving averages reveals several bearish signals that could impact this trend:
Bearish price crossover with Moving Average 20
Type : Bearish
Timeframe : Weekly
Bearish price crossover with Moving Average 50
Type : Bearish
Timeframe : Weekly
Bearish price crossover with adaptative moving average 20
Type : Bearish
Timeframe : Weekly
Bearish price crossover with adaptative moving average 50
Type : Bearish
Timeframe : Weekly
In fact, Central Analyzer took into account 18 technical indicators and the result was as follows: 3 are bullish, 9 are neutral and 6 are bearish. Caution: the Central Indicators scanner currently detects an excess:
CCI indicator: bearish divergence
Type : Bearish
Timeframe : Weekly
MACD indicator: bearish divergence
Type : Bullish
Timeframe : Weekly
Williams %R indicator is oversold : under -80
Type : Neutral
Timeframe : Weekly
Pivot points : price is under support 3
Type : Neutral
Timeframe : Weekly
RSI indicator is back under 50
Type : Bearish
Timeframe : Weekly
MACD crosses DOWN its Moving Average
Type : Bearish
Timeframe : Weekly
Momentum indicator is back under 0
Type : Bearish
Timeframe : Weekly
The Central Patterns scanner, which studies chart patterns, resistances and supports, has identified these signals:
Near horizontal support
Type : Bullish
Timeframe : Weekly
Near support of triangle
Type : Bullish
Timeframe : Weekly
Support of channel is broken
Type : Bearish
Timeframe : Weekly
For a small setback in the very short term, the Central Candlesticks scanner currently notes the presence of this bearish pattern in Japanese candlesticks:
Black gravestone / inverted hammer
Type : Bearish
Timeframe : Weekly
| S3 | S2 | S1 | Price | R1 | R2 | |
|---|---|---|---|---|---|---|
| ProTrendLines | 210.17 | 334.39 | 405.54 | 414.99 | 437.81 | 465.79 |
| Change (%) | -49.36% | -19.42% | -2.28% | - | +5.50% | +12.24% |
| Change | -204.82 | -80.60 | -9.45 | - | +22.82 | +50.80 |
| Level | Major | Major | Major | - | Major | Major |
To determine price objectives, it is also possible to use the pivot points. Here is the price position in relation to pivot points:
| Pivot points | S3 | S2 | S1 | PP | R1 | R2 | R3 |
|---|---|---|---|---|---|---|---|
| Standard | 401.45 | 407.30 | 411.15 | 417.00 | 420.85 | 426.70 | 430.55 |
| Camarilla | 412.32 | 413.21 | 414.10 | 414.99 | 415.88 | 416.77 | 417.66 |
| Woodie | 400.44 | 406.80 | 410.14 | 416.50 | 419.84 | 426.20 | 429.54 |
| Fibonacci | 407.30 | 411.01 | 413.30 | 417.00 | 420.71 | 423.00 | 426.70 |
| Pivot points | S3 | S2 | S1 | PP | R1 | R2 | R3 |
|---|---|---|---|---|---|---|---|
| Standard | 409.01 | 417.31 | 430.68 | 438.98 | 452.35 | 460.65 | 474.02 |
| Camarilla | 438.10 | 440.09 | 442.07 | 444.06 | 446.05 | 448.03 | 450.02 |
| Woodie | 411.56 | 418.58 | 433.23 | 440.25 | 454.90 | 461.92 | 476.57 |
| Fibonacci | 417.31 | 425.59 | 430.70 | 438.98 | 447.26 | 452.37 | 460.65 |
| Pivot points | S3 | S2 | S1 | PP | R1 | R2 | R3 |
|---|---|---|---|---|---|---|---|
| Standard | 373.89 | 397.27 | 409.39 | 432.77 | 444.89 | 468.27 | 480.39 |
| Camarilla | 411.74 | 414.99 | 418.25 | 421.50 | 424.75 | 428.01 | 431.26 |
| Woodie | 368.25 | 394.46 | 403.75 | 429.96 | 439.25 | 465.46 | 474.75 |
| Fibonacci | 397.27 | 410.83 | 419.21 | 432.77 | 446.33 | 454.71 | 468.27 |
Numerical data
The following is the status of the technical indicators and moving averages at the time of publication of this technical analysis:
| RSI (14): | 46.67 | |
| MACD (12,26,9): | 2.7300 | |
| Directional Movement: | -0.09 | |
| AROON (14): | 35.71 | |
| DEMA (21): | 430.10 | |
| Parabolic SAR (0,02-0,02-0,2): | 454.37 | |
| Elder Ray (13): | 3.59 | |
| Super Trend (3,10): | 456.71 | |
| Zig ZAG (10): | 414.99 | |
| VORTEX (21): | 1.0200 | |
| Stochastique (14,3,5): | 47.85 | |
| TEMA (21): | 427.26 | |
| Williams %R (14): | -80.10 | |
| Chande Momentum Oscillator (20): | -6.71 | |
| Repulse (5,40,3): | -2.9300 | |
| ROCnROLL: | -1 | |
| TRIX (15,9): | 0.1000 | |
| Courbe Coppock: | 4.47 |
| MA7: | 439.44 | |
| MA20: | 428.72 | |
| MA50: | 431.29 | |
| MA100: | 426.26 | |
| MAexp7: | 427.48 | |
| MAexp20: | 426.04 | |
| MAexp50: | 413.28 | |
| MAexp100: | 381.60 | |
| Price / MA7: | -5.56% | |
| Price / MA20: | -3.20% | |
| Price / MA50: | -3.78% | |
| Price / MA100: | -2.64% | |
| Price / MAexp7: | -2.92% | |
| Price / MAexp20: | -2.59% | |
| Price / MAexp50: | +0.41% | |
| Price / MAexp100: | +8.75% |
News
The latest news and videos published on MICROSOFT CORP. at the time of the analysis were as follows:
- Is Microsoft Corp. (NASDAQ:MSFT) Overvalued? Or Is It Worth Buying Now?
- Preservica Expands Availability of its Microsoft 365 Archiving and Digital Preservation Solution to Canada
- Euroclear enters into 7-year strategic partnership with Microsoft harnessing cloud, data and AI
- Euroclear enters into 7-year strategic partnership with Microsoft harnessing cloud, data and AI
- Microsoft earnings press release available on Investor Relations website
About author

Online


Add a comment
Comments
0 comments on the analysis MICROSOFT CORP. - Weekly