ROKU INC. - Daily - Technical analysis published on 12/26/2019 (GMT)
- 437
- 0
- Who voted?
Click here for a new analysis!
- Timeframe : Daily
- - Analysis generated on
- Status : INVALID

Summary of the analysis

Additional analysis
Quotes
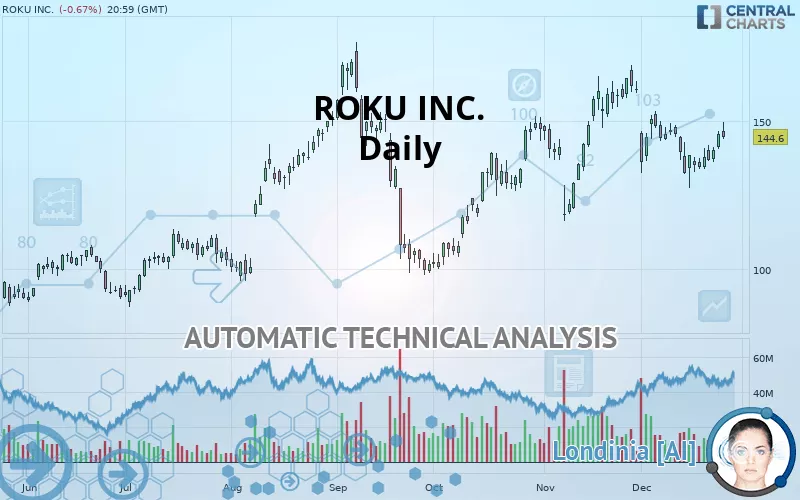
ROKU INC. rating 144.60 USD. On the day, this instrument lost -0.67% and was between 143.82 USD and 149.49 USD. This implies that the price is at +0.54% from its lowest and at -3.27% from its highest.The Central Gaps scanner detects the formation of a bullish gap marking the strong presence of buyers against sellers at the opening. This formed a quotation gap.
Opening Gap UP
Type : Bullish
Timeframe : Openning
Here is a more detailed summary of the historical variations registered by ROKU INC.:
Technical
A technical analysis in Daily of this ROKU INC. chart shows a strongly bullish trend. 89.29% of the signals given by moving averages are bullish. The slightly bullish signals given by the short-term moving averages indicate this trend is showing signs of running out of steam. An assessment of moving averages reveals several bullish signals that could impact this trend:
Bullish trend reversal : adaptative moving average 20
Type : Bullish
Timeframe : Daily
Bullish trend reversal : adaptative moving average 50
Type : Bullish
Timeframe : Daily
Bullish price crossover with Moving Average 20
Type : Bullish
Timeframe : Daily
Bullish price crossover with Moving Average 50
Type : Bullish
Timeframe : Daily
Bullish price crossover with adaptative moving average 20
Type : Bullish
Timeframe : Daily
Bullish price crossover with adaptative moving average 50
Type : Bullish
Timeframe : Daily
Bullish price crossover with adaptative moving average 100
Type : Bullish
Timeframe : Daily
An assessment of technical indicators does not currently provide any relevant information on the direction of future price movements.
But beware of excesses. The Central Indicators scanner currently detects this:
Williams %R indicator is overbought : over -20
Type : Neutral
Timeframe : Daily
Pivot points : price is over resistance 1
Type : Neutral
Timeframe : Weekly
RSI indicator is back over 50
Type : Bullish
Timeframe : Daily
Price is back over the pivot point
Type : Bullish
Timeframe : Daily
Momentum indicator is back over 0
Type : Bullish
Timeframe : Daily
Williams %R indicator is back over -50
Type : Bullish
Timeframe : Daily
The Central Patterns scanner, which studies chart patterns, resistances and supports, has identified these signals:
Near support of channel
Type : Bullish
Timeframe : Daily
Near support of triangle
Type : Bullish
Timeframe : Daily
The Central Candlesticks scanner, specialised in Japanese candlesticks, did not identify any signals.
| S3 | S2 | S1 | Price | R1 | R2 | |
|---|---|---|---|---|---|---|
| ProTrendLines | 99.32 | 118.46 | 132.49 | 144.60 | 149.65 | 169.86 |
| Change (%) | -31.31% | -18.08% | -8.37% | - | +3.49% | +17.47% |
| Change | -45.28 | -26.14 | -12.11 | - | +5.05 | +25.26 |
| Level | Major | Intermediate | Major | - | Intermediate | Major |
To determine price objectives, it is also possible to use the pivot points. Here is the price position in relation to pivot points:
| Pivot points | S3 | S2 | S1 | PP | R1 | R2 | R3 |
|---|---|---|---|---|---|---|---|
| Standard | 135.59 | 138.04 | 141.81 | 144.26 | 148.03 | 150.49 | 154.25 |
| Camarilla | 143.86 | 144.43 | 145.00 | 145.57 | 146.14 | 146.71 | 147.28 |
| Woodie | 136.24 | 138.37 | 142.46 | 144.59 | 148.68 | 150.81 | 154.90 |
| Fibonacci | 138.04 | 140.42 | 141.89 | 144.26 | 146.64 | 148.11 | 150.49 |
| Pivot points | S3 | S2 | S1 | PP | R1 | R2 | R3 |
|---|---|---|---|---|---|---|---|
| Standard | 114.65 | 121.09 | 128.99 | 135.43 | 143.33 | 149.77 | 157.67 |
| Camarilla | 132.95 | 134.26 | 135.58 | 136.89 | 138.21 | 139.52 | 140.83 |
| Woodie | 115.38 | 121.46 | 129.72 | 135.80 | 144.06 | 150.14 | 158.40 |
| Fibonacci | 121.09 | 126.57 | 129.95 | 135.43 | 140.91 | 144.29 | 149.77 |
| Pivot points | S3 | S2 | S1 | PP | R1 | R2 | R3 |
|---|---|---|---|---|---|---|---|
| Standard | 75.55 | 95.90 | 128.14 | 148.49 | 180.73 | 201.08 | 233.32 |
| Camarilla | 145.91 | 150.73 | 155.55 | 160.37 | 165.19 | 170.01 | 174.83 |
| Woodie | 81.49 | 98.87 | 134.08 | 151.46 | 186.67 | 204.05 | 239.26 |
| Fibonacci | 95.90 | 115.99 | 128.40 | 148.49 | 168.58 | 180.99 | 201.08 |
Numerical data
The following is the status of the technical indicators and moving averages at the time of publication of this technical analysis:
| RSI (14): | 51.64 | |
| MACD (12,26,9): | -1.1400 | |
| Directional Movement: | -0.29 | |
| AROON (14): | -50.00 | |
| DEMA (21): | 141.38 | |
| Parabolic SAR (0,02-0,02-0,2): | 149.60 | |
| Elder Ray (13): | 4.50 | |
| Super Trend (3,10): | 158.48 | |
| Zig ZAG (10): | 144.30 | |
| VORTEX (21): | 0.9700 | |
| Stochastique (14,3,5): | 64.83 | |
| TEMA (21): | 138.48 | |
| Williams %R (14): | -24.19 | |
| Chande Momentum Oscillator (20): | -1.08 | |
| Repulse (5,40,3): | -0.6900 | |
| ROCnROLL: | 1 | |
| TRIX (15,9): | -0.1100 | |
| Courbe Coppock: | 12.26 |
| MA7: | 139.24 | |
| MA20: | 143.45 | |
| MA50: | 142.96 | |
| MA100: | 136.26 | |
| MAexp7: | 141.33 | |
| MAexp20: | 142.44 | |
| MAexp50: | 140.53 | |
| MAexp100: | 131.97 | |
| Price / MA7: | +3.85% | |
| Price / MA20: | +0.80% | |
| Price / MA50: | +1.15% | |
| Price / MA100: | +6.12% | |
| Price / MAexp7: | +2.31% | |
| Price / MAexp20: | +1.52% | |
| Price / MAexp50: | +2.90% | |
| Price / MAexp100: | +9.57% |
News
Don"t forget to follow the news on ROKU INC.. At the time of publication of this analysis, the latest news was as follows:
- Walmart and Roku Launch New Atvio Roku TV Lineup in Mexico
- Steve Louden to Step Down as Roku Chief Financial Officer
- Roku Tops Off Year of Entertainment with Unlocked Premium Content for Second Annual Stream-a-thon
- Roku to Acquire dataxu to Strengthen Industry-Leading OTT Advertising Platform
- Roku to Announce Third Quarter 2019 Financial Results on November 6
About author

Online


Add a comment
Comments
0 comments on the analysis ROKU INC. - Daily