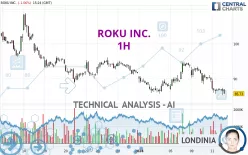
ROKU INC. - 1H - Technical analysis published on 01/12/2024 (GMT)
- 154
- 0
Click here for a new analysis!
- Timeframe : 1H
- - Analysis generated on
- Status : LEVEL MAINTAINED

Summary of the analysis

Additional analysis
Quotes
The ROKU INC. rating is 86.27 USD. The price registered a decrease of -0.44% on the session and was between 85.25 USD and 87.35 USD. This implies that the price is at +1.20% from its lowest and at -1.24% from its highest.A bearish opening was detected by the Central Gaps scanner. Sellers are trying to impose a bearish trend in the very short term.
Bearish opening
Type : Bearish
Timeframe : Openning
Here is a more detailed summary of the historical variations registered by ROKU INC.:
New LOW record (1st january)
Type : Bearish
Timeframe : Weekly
New LOW record (1 month)
Type : Bearish
Timeframe : Weekly
Technical
A technical analysis in 1H of this ROKU INC. chart shows a sharp bearish trend. The signals given by moving averages are 92.86% bearish. This strong bearish trend is confirmed by the strong signals currently being given by short-term moving averages. The Central Indicators market scanner currently does not detect any result that concerns moving averages.
The technical indicators are generally neutral. They do not provide relevant information on the direction of future price movements.
Caution: the Central Indicators scanner currently detects an excess:
Williams %R indicator is oversold : under -80
Type : Neutral
Timeframe : 1 hour
Pivot points : price is under support 1
Type : Neutral
Timeframe : Weekly
Central Patterns, the market scanner focusing on chart patterns, resistances and supports found this result:
Near support of channel
Type : Bullish
Timeframe : 1 hour
No result was found by the Central Candlesticks scanner on Japanese candlesticks.
| S3 | S2 | S1 | Price | R1 | R2 | R3 | |
|---|---|---|---|---|---|---|---|
| ProTrendLines | 54.98 | 61.53 | 73.26 | 86.27 | 86.40 | 88.71 | 97.81 |
| Change (%) | -36.27% | -28.68% | -15.08% | - | +0.15% | +2.83% | +13.38% |
| Change | -31.29 | -24.74 | -13.01 | - | +0.13 | +2.44 | +11.54 |
| Level | Major | Minor | Intermediate | - | Major | Minor | Major |
To determine price objectives, it is also possible to use the pivot points. Here is the price position in relation to pivot points:
| Pivot points | S3 | S2 | S1 | PP | R1 | R2 | R3 |
|---|---|---|---|---|---|---|---|
| Standard | 80.38 | 82.98 | 84.81 | 87.41 | 89.24 | 91.84 | 93.67 |
| Camarilla | 85.43 | 85.84 | 86.24 | 86.65 | 87.06 | 87.46 | 87.87 |
| Woodie | 80.01 | 82.79 | 84.44 | 87.22 | 88.87 | 91.65 | 93.30 |
| Fibonacci | 82.98 | 84.67 | 85.71 | 87.41 | 89.10 | 90.14 | 91.84 |
| Pivot points | S3 | S2 | S1 | PP | R1 | R2 | R3 |
|---|---|---|---|---|---|---|---|
| Standard | 81.02 | 83.36 | 86.33 | 88.67 | 91.64 | 93.98 | 96.95 |
| Camarilla | 87.83 | 88.32 | 88.80 | 89.29 | 89.78 | 90.26 | 90.75 |
| Woodie | 81.33 | 83.52 | 86.64 | 88.83 | 91.95 | 94.14 | 97.26 |
| Fibonacci | 83.36 | 85.39 | 86.65 | 88.67 | 90.70 | 91.96 | 93.98 |
| Pivot points | S3 | S2 | S1 | PP | R1 | R2 | R3 |
|---|---|---|---|---|---|---|---|
| Standard | 63.84 | 76.27 | 83.97 | 96.40 | 104.10 | 116.53 | 124.23 |
| Camarilla | 86.12 | 87.97 | 89.82 | 91.66 | 93.51 | 95.35 | 97.20 |
| Woodie | 61.47 | 75.09 | 81.60 | 95.22 | 101.73 | 115.35 | 121.86 |
| Fibonacci | 76.27 | 83.96 | 88.71 | 96.40 | 104.09 | 108.84 | 116.53 |
Numerical data
The following is the status of the technical indicators and moving averages at the time of publication of this technical analysis:
| RSI (14): | 34.31 | |
| MACD (12,26,9): | -1.2100 | |
| Directional Movement: | -24.21 | |
| AROON (14): | -85.72 | |
| DEMA (21): | 87.13 | |
| Parabolic SAR (0,02-0,02-0,2): | 88.11 | |
| Elder Ray (13): | -1.39 | |
| Super Trend (3,10): | 90.19 | |
| Zig ZAG (10): | 86.64 | |
| VORTEX (21): | 0.8300 | |
| Stochastique (14,3,5): | 21.96 | |
| TEMA (21): | 86.13 | |
| Williams %R (14): | -78.14 | |
| Chande Momentum Oscillator (20): | -3.53 | |
| Repulse (5,40,3): | 0.7400 | |
| ROCnROLL: | 2 | |
| TRIX (15,9): | -0.1400 | |
| Courbe Coppock: | 9.58 |
| MA7: | 89.37 | |
| MA20: | 91.76 | |
| MA50: | 92.80 | |
| MA100: | 82.22 | |
| MAexp7: | 87.02 | |
| MAexp20: | 88.49 | |
| MAexp50: | 89.77 | |
| MAexp100: | 91.30 | |
| Price / MA7: | -3.47% | |
| Price / MA20: | -5.98% | |
| Price / MA50: | -7.04% | |
| Price / MA100: | +4.93% | |
| Price / MAexp7: | -0.86% | |
| Price / MAexp20: | -2.51% | |
| Price / MAexp50: | -3.90% | |
| Price / MAexp100: | -5.51% |
News
Don't forget to follow the news on ROKU INC.. At the time of publication of this analysis, the latest news was as follows:
- Roku Founder & CEO to Participate in Fireside Chat Hosted by Morgan Stanley
- Roku Chief Financial Officer to Present at BMO’s Digital Advertising Summit
- Roku Joins Sound Hub Denmark
- Roku Announces Industry-First Advertising Watermark to Protect from Ad Spoofing
- Multi-Award-Winning Australian Drama “The Newsreader” to Premiere in the United States Exclusively on The Roku Channel as a Roku Original on March 18
About author

Online


Add a comment
Comments
0 comments on the analysis ROKU INC. - 1H