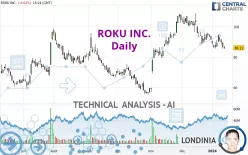
ROKU INC. - Daily - Technical analysis published on 01/12/2024 (GMT)
- 147
- 0
Click here for a new analysis!
- Timeframe : Daily
- - Analysis generated on
- Status : LEVEL MAINTAINED

Summary of the analysis

Additional analysis
Quotes
ROKU INC. rating 86.11 USD. The price registered a decrease of -0.62% on the session with the lowest point at 85.25 USD and the highest point at 87.35 USD. The deviation from the price is +1.01% for the low point and -1.42% for the high point.The Central Gaps scanner detects a bearish opening. A small advantage for sellers in the very short term.
Bearish opening
Type : Bearish
Timeframe : Openning
A study of price movements over other periods shows the following variations:
New LOW record (1st january)
Type : Bearish
Timeframe : Weekly
New LOW record (1 month)
Type : Bearish
Timeframe : Weekly
Technical
Technical analysis of this Daily chart of ROKU INC. indicates that the overall trend is slightly bullish. 53.57% of the signals given by moving averages are bullish. Caution: a reversal of the trend could be possible given the strong bearish signals of short-term moving averages. The Central Indicators market scanner is currently detecting a bearish signal that could impact this trend:
Moving Average bearish crossovers : MA20 & MA50
Type : Bearish
Timeframe : Daily
The probability of a further decline is high given the direction of the technical indicators.
But beware of excesses. The Central Indicators scanner currently detects this:
CCI indicator is oversold : under -100
Type : Neutral
Timeframe : Daily
Williams %R indicator is oversold : under -80
Type : Neutral
Timeframe : Daily
Pivot points : price is under support 1
Type : Neutral
Timeframe : Weekly
Central Patterns, the scanner specializing in chart patterns, did not identify any signals.
From the Japanese candlestick perspective, the Central Candlesticks scanner notes the presence of these results that could impact the short-term trend:
White hanging man / hammer
Type : Neutral
Timeframe : Daily
Doji
Type : Neutral
Timeframe : Daily
| S3 | S2 | S1 | Price | R1 | R2 | R3 | |
|---|---|---|---|---|---|---|---|
| ProTrendLines | 54.98 | 61.53 | 73.26 | 86.11 | 86.40 | 97.81 | 106.87 |
| Change (%) | -36.15% | -28.54% | -14.92% | - | +0.34% | +13.59% | +24.11% |
| Change | -31.13 | -24.58 | -12.85 | - | +0.29 | +11.70 | +20.76 |
| Level | Major | Minor | Intermediate | - | Major | Major | Major |
Pivot points can also be used to set your price objectives. Here is the price situation in relation to pivot points:
| Pivot points | S3 | S2 | S1 | PP | R1 | R2 | R3 |
|---|---|---|---|---|---|---|---|
| Standard | 80.38 | 82.98 | 84.81 | 87.41 | 89.24 | 91.84 | 93.67 |
| Camarilla | 85.43 | 85.84 | 86.24 | 86.65 | 87.06 | 87.46 | 87.87 |
| Woodie | 80.01 | 82.79 | 84.44 | 87.22 | 88.87 | 91.65 | 93.30 |
| Fibonacci | 82.98 | 84.67 | 85.71 | 87.41 | 89.10 | 90.14 | 91.84 |
| Pivot points | S3 | S2 | S1 | PP | R1 | R2 | R3 |
|---|---|---|---|---|---|---|---|
| Standard | 81.02 | 83.36 | 86.33 | 88.67 | 91.64 | 93.98 | 96.95 |
| Camarilla | 87.83 | 88.32 | 88.80 | 89.29 | 89.78 | 90.26 | 90.75 |
| Woodie | 81.33 | 83.52 | 86.64 | 88.83 | 91.95 | 94.14 | 97.26 |
| Fibonacci | 83.36 | 85.39 | 86.65 | 88.67 | 90.70 | 91.96 | 93.98 |
| Pivot points | S3 | S2 | S1 | PP | R1 | R2 | R3 |
|---|---|---|---|---|---|---|---|
| Standard | 63.84 | 76.27 | 83.97 | 96.40 | 104.10 | 116.53 | 124.23 |
| Camarilla | 86.12 | 87.97 | 89.82 | 91.66 | 93.51 | 95.35 | 97.20 |
| Woodie | 61.47 | 75.09 | 81.60 | 95.22 | 101.73 | 115.35 | 121.86 |
| Fibonacci | 76.27 | 83.96 | 88.71 | 96.40 | 104.09 | 108.84 | 116.53 |
Numerical data
The following is the status of technical indicators and moving averages registered at the time this technical analysis was created:
| RSI (14): | 40.86 | |
| MACD (12,26,9): | -1.5600 | |
| Directional Movement: | -6.90 | |
| AROON (14): | -78.57 | |
| DEMA (21): | 90.00 | |
| Parabolic SAR (0,02-0,02-0,2): | 92.65 | |
| Elder Ray (13): | -4.03 | |
| Super Trend (3,10): | 97.83 | |
| Zig ZAG (10): | 86.56 | |
| VORTEX (21): | 0.7900 | |
| Stochastique (14,3,5): | 20.12 | |
| TEMA (21): | 86.58 | |
| Williams %R (14): | -87.38 | |
| Chande Momentum Oscillator (20): | -8.31 | |
| Repulse (5,40,3): | -1.9800 | |
| ROCnROLL: | 2 | |
| TRIX (15,9): | -0.1500 | |
| Courbe Coppock: | 11.23 |
| MA7: | 89.37 | |
| MA20: | 91.76 | |
| MA50: | 92.80 | |
| MA100: | 82.22 | |
| MAexp7: | 88.93 | |
| MAexp20: | 91.41 | |
| MAexp50: | 89.81 | |
| MAexp100: | 84.58 | |
| Price / MA7: | -3.65% | |
| Price / MA20: | -6.16% | |
| Price / MA50: | -7.21% | |
| Price / MA100: | +4.73% | |
| Price / MAexp7: | -3.17% | |
| Price / MAexp20: | -5.80% | |
| Price / MAexp50: | -4.12% | |
| Price / MAexp100: | +1.81% |
News
Don't forget to follow the news on ROKU INC.. At the time of publication of this analysis, the latest news was as follows:
- Roku Founder & CEO to Participate in Fireside Chat Hosted by Morgan Stanley
- Roku Chief Financial Officer to Present at BMO’s Digital Advertising Summit
- Roku Joins Sound Hub Denmark
- Roku Announces Industry-First Advertising Watermark to Protect from Ad Spoofing
- Multi-Award-Winning Australian Drama “The Newsreader” to Premiere in the United States Exclusively on The Roku Channel as a Roku Original on March 18
About author

Online


Add a comment
Comments
0 comments on the analysis ROKU INC. - Daily