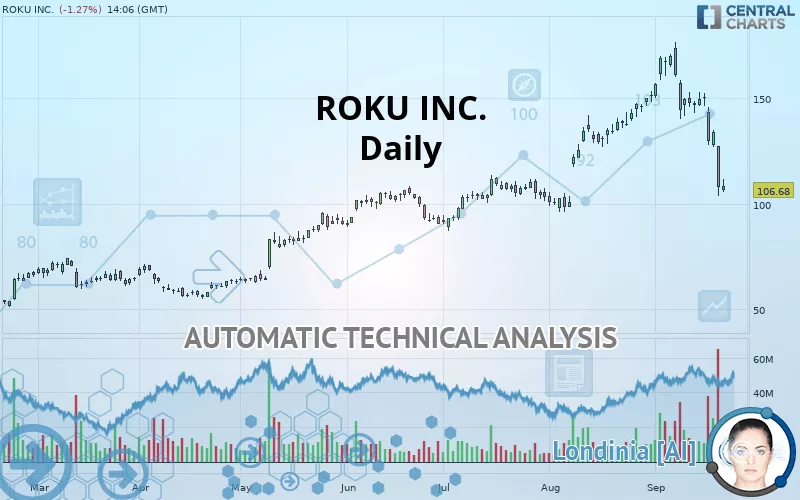
ROKU INC. - Daily - Technical analysis published on 09/23/2019 (GMT)
- 208
- 0
- Who voted?
Click here for a new analysis!
- Timeframe : Daily
- - Analysis generated on
- Status : TARGET REACHED

Summary of the analysis

Additional analysis
Quotes
ROKU INC. rating 106.68 USD. The price is lower by -1.27% since the last closing and was traded between 105.68 USD and 111.79 USD over the period. The price is currently at +0.95% from its lowest and -4.57% from its highest.The Central Gaps scanner detects a bullish opening. A small advantage for buyers in the very short term.
Bullish opening
Type : Bullish
Timeframe : Openning
A study of price movements over other periods shows the following variations:
Near a new LOW record (1 month)
Type : Bearish
Timeframe : Weekly
Abnormal volumes on ROKU INC. were detected by the Central Volumes scanner:
Abnormal volumes
Timeframe : 5 days
Technical
A technical analysis in Daily of this ROKU INC. chart shows a slightly bearish trend. Only 53.57% of the signals given by moving averages are bearish. This slightly bearish trend is reinforced by the strong signals currently being given by short-term moving averages. The Central Indicators scanner detects bearish signals on moving averages that could impact this trend:
Bearish trend reversal : adaptative moving average 100
Type : Bearish
Timeframe : Daily
Bearish price crossover with Moving Average 50
Type : Bearish
Timeframe : Daily
Bearish price crossover with Moving Average 100
Type : Bearish
Timeframe : Daily
In fact, Central Analyzer took into account 18 technical indicators and the result was as follows: 4 are bullish, 4 are neutral and 10 are bearish. Caution: the Central Indicators scanner currently detects an excess:
CCI indicator is oversold : under -100
Type : Neutral
Timeframe : Daily
Williams %R indicator is oversold : under -80
Type : Neutral
Timeframe : Daily
Ichimoku : price is under the cloud
Type : Bearish
Timeframe : Daily
Ichimoku - Bearish crossover : Tenkan & Kijun
Type : Bearish
Timeframe : Daily
Price is back under the pivot point
Type : Bearish
Timeframe : Daily
Price is back under the pivot point
Type : Bearish
Timeframe : Weekly
An analysis of the price chart with the Central Patterns scanner (detector of chart patterns and resistances and supports) shows several results that can have an impact on the price change:
Horizontal support is broken
Type : Bearish
Timeframe : Daily
Support of channel is broken
Type : Bearish
Timeframe : Daily
The Central Candlesticks scanner, specialised in Japanese candlesticks, did not identify any signals.
| S3 | S2 | S1 | Price | R1 | R2 | |
|---|---|---|---|---|---|---|
| ProTrendLines | 56.55 | 76.48 | 106.49 | 106.68 | 144.14 | 169.86 |
| Change (%) | -46.99% | -28.31% | -0.18% | - | +35.11% | +59.22% |
| Change | -50.13 | -30.20 | -0.19 | - | +37.46 | +63.18 |
| Level | Intermediate | Major | Major | - | Minor | Major |
Attention could also be paid to pivot points to set price objectives:
| Pivot points | S3 | S2 | S1 | PP | R1 | R2 | R3 |
|---|---|---|---|---|---|---|---|
| Standard | 74.87 | 89.24 | 98.65 | 113.02 | 122.43 | 136.80 | 146.21 |
| Camarilla | 101.51 | 103.69 | 105.87 | 108.05 | 110.23 | 112.41 | 114.59 |
| Woodie | 72.38 | 88.00 | 96.16 | 111.78 | 119.94 | 135.56 | 143.72 |
| Fibonacci | 89.24 | 98.33 | 103.94 | 113.02 | 122.11 | 127.72 | 136.80 |
| Pivot points | S3 | S2 | S1 | PP | R1 | R2 | R3 |
|---|---|---|---|---|---|---|---|
| Standard | 40.93 | 72.28 | 90.16 | 121.51 | 139.39 | 170.74 | 188.62 |
| Camarilla | 94.51 | 99.02 | 103.54 | 108.05 | 112.56 | 117.08 | 121.59 |
| Woodie | 34.21 | 68.91 | 83.44 | 118.14 | 132.67 | 167.37 | 181.90 |
| Fibonacci | 72.28 | 91.08 | 102.70 | 121.51 | 140.31 | 151.93 | 170.74 |
| Pivot points | S3 | S2 | S1 | PP | R1 | R2 | R3 |
|---|---|---|---|---|---|---|---|
| Standard | 56.52 | 76.26 | 113.81 | 133.55 | 171.10 | 190.84 | 228.39 |
| Camarilla | 135.61 | 140.86 | 146.11 | 151.36 | 156.61 | 161.86 | 167.12 |
| Woodie | 65.43 | 80.71 | 122.72 | 138.00 | 180.01 | 195.29 | 237.30 |
| Fibonacci | 76.26 | 98.15 | 111.67 | 133.55 | 155.44 | 168.96 | 190.84 |
Numerical data
The following are the details of the technical indicators and moving averages that were collected to generate this technical analysis:
| RSI (14): | 34.20 | |
| MACD (12,26,9): | -2.2100 | |
| Directional Movement: | -19.03 | |
| AROON (14): | -64.29 | |
| DEMA (21): | 138.48 | |
| Parabolic SAR (0,02-0,02-0,2): | 163.38 | |
| Elder Ray (13): | -26.85 | |
| Super Trend (3,10): | 141.76 | |
| Zig ZAG (10): | 109.20 | |
| VORTEX (21): | 0.7900 | |
| Stochastique (14,3,5): | 8.78 | |
| TEMA (21): | 128.37 | |
| Williams %R (14): | -93.95 | |
| Chande Momentum Oscillator (20): | -59.37 | |
| Repulse (5,40,3): | -17.2600 | |
| ROCnROLL: | 2 | |
| TRIX (15,9): | 0.5300 | |
| Courbe Coppock: | 28.66 |
| MA7: | 132.17 | |
| MA20: | 146.62 | |
| MA50: | 128.45 | |
| MA100: | 110.20 | |
| MAexp7: | 127.08 | |
| MAexp20: | 138.03 | |
| MAexp50: | 129.61 | |
| MAexp100: | 113.48 | |
| Price / MA7: | -19.29% | |
| Price / MA20: | -27.24% | |
| Price / MA50: | -16.95% | |
| Price / MA100: | -3.19% | |
| Price / MAexp7: | -16.05% | |
| Price / MAexp20: | -22.71% | |
| Price / MAexp50: | -17.69% | |
| Price / MAexp100: | -5.99% |
News
The last news published on ROKU INC. at the time of the generation of this analysis was as follows:
- Roku and Innovid Bring Sophisticated Measurement Tools to TV
- Roku Announces New Streaming Player Line-up for Canada
- Roku Announces New Streaming Player Line-up for UK
- Roku OS 9.2 to Deliver New Search and Discovery Features and Enhanced Roku Voice Functionality
- Roku Introduces New Streaming Player Lineup
About author

Online


Add a comment
Comments
0 comments on the analysis ROKU INC. - Daily