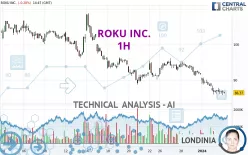
ROKU INC. - 1H - Technical analysis published on 01/04/2024 (GMT)
- 133
- 0
Click here for a new analysis!
- Timeframe : 1H
- - Analysis generated on
- Status : INVALID

Summary of the analysis

Additional analysis
Quotes
ROKU INC. rating 86.04 USD. The price is lower by -0.66% since the last closing and was traded between 85.71 USD and 86.87 USD over the period. The price is currently at +0.39% from its lowest and -0.96% from its highest.A bullish opening was detected by the Central Gaps scanner. Buyers are trying to impose a bullish momentum in the very short term.
Bullish opening
Type : Bullish
Timeframe : Openning
Here is a more detailed summary of the historical variations registered by ROKU INC.:
Near a new HIGH record (1st january)
Type : Bullish
Timeframe : Weekly
New LOW record (1 month)
Type : Bearish
Timeframe : Weekly
Technical
Technical analysis of ROKU INC. in 1H shows a overall strongly bearish trend. The signals given by moving averages are 92.86% bearish. This strong bearish trend is confirmed by the strong signals currently being given by short-term moving averages. There is no crossing of moving average by the price or crossing of moving averages between themselves.
On the 18 technical indicators analysed, 5 are bullish, 2 are neutral and 11 are bearish. Caution: the Central Indicators scanner currently detects an excess:
RSI indicator is oversold : under 30
Type : Neutral
Timeframe : 1 hour
Williams %R indicator is oversold : under -80
Type : Neutral
Timeframe : 1 hour
Pivot points : price is under support 3
Type : Neutral
Timeframe : Weekly
Parabolic SAR indicator bearish reversal
Type : Bearish
Timeframe : 1 hour
No signals are given by Central Patterns, a market scanner specialised in chart patterns, resistances and supports.
No result was found by the Central Candlesticks scanner on Japanese candlesticks.
| S3 | S2 | S1 | Price | R1 | R2 | R3 | |
|---|---|---|---|---|---|---|---|
| ProTrendLines | 61.53 | 73.26 | 85.87 | 86.04 | 89.11 | 97.81 | 102.48 |
| Change (%) | -28.49% | -14.85% | -0.20% | - | +3.57% | +13.68% | +19.11% |
| Change | -24.51 | -12.78 | -0.17 | - | +3.07 | +11.77 | +16.44 |
| Level | Minor | Intermediate | Intermediate | - | Intermediate | Major | Minor |
Attention could also be paid to pivot points to set price objectives:
| Pivot points | S3 | S2 | S1 | PP | R1 | R2 | R3 |
|---|---|---|---|---|---|---|---|
| Standard | 83.00 | 84.44 | 85.52 | 86.96 | 88.04 | 89.48 | 90.56 |
| Camarilla | 85.92 | 86.15 | 86.38 | 86.61 | 86.84 | 87.07 | 87.30 |
| Woodie | 82.83 | 84.35 | 85.35 | 86.87 | 87.87 | 89.39 | 90.39 |
| Fibonacci | 84.44 | 85.40 | 85.99 | 86.96 | 87.92 | 88.51 | 89.48 |
| Pivot points | S3 | S2 | S1 | PP | R1 | R2 | R3 |
|---|---|---|---|---|---|---|---|
| Standard | 84.83 | 87.96 | 89.81 | 92.94 | 94.79 | 97.92 | 99.77 |
| Camarilla | 90.29 | 90.75 | 91.20 | 91.66 | 92.12 | 92.57 | 93.03 |
| Woodie | 84.19 | 87.64 | 89.17 | 92.62 | 94.15 | 97.60 | 99.13 |
| Fibonacci | 87.96 | 89.86 | 91.04 | 92.94 | 94.84 | 96.02 | 97.92 |
| Pivot points | S3 | S2 | S1 | PP | R1 | R2 | R3 |
|---|---|---|---|---|---|---|---|
| Standard | 63.84 | 76.27 | 83.97 | 96.40 | 104.10 | 116.53 | 124.23 |
| Camarilla | 86.12 | 87.97 | 89.82 | 91.66 | 93.51 | 95.35 | 97.20 |
| Woodie | 61.47 | 75.09 | 81.60 | 95.22 | 101.73 | 115.35 | 121.86 |
| Fibonacci | 76.27 | 83.96 | 88.71 | 96.40 | 104.09 | 108.84 | 116.53 |
Numerical data
The following is the status of technical indicators and moving averages registered at the time this technical analysis was created:
| RSI (14): | 23.68 | |
| MACD (12,26,9): | -1.7000 | |
| Directional Movement: | -24.23 | |
| AROON (14): | -100.00 | |
| DEMA (21): | 86.52 | |
| Parabolic SAR (0,02-0,02-0,2): | 87.83 | |
| Elder Ray (13): | -1.43 | |
| Super Trend (3,10): | 89.73 | |
| Zig ZAG (10): | 86.35 | |
| VORTEX (21): | 0.7200 | |
| Stochastique (14,3,5): | 14.03 | |
| TEMA (21): | 85.76 | |
| Williams %R (14): | -88.05 | |
| Chande Momentum Oscillator (20): | -2.98 | |
| Repulse (5,40,3): | 0.0900 | |
| ROCnROLL: | 2 | |
| TRIX (15,9): | -0.2400 | |
| Courbe Coppock: | 9.30 |
| MA7: | 91.01 | |
| MA20: | 95.38 | |
| MA50: | 88.98 | |
| MA100: | 81.63 | |
| MAexp7: | 87.04 | |
| MAexp20: | 88.62 | |
| MAexp50: | 90.99 | |
| MAexp100: | 93.16 | |
| Price / MA7: | -5.46% | |
| Price / MA20: | -9.79% | |
| Price / MA50: | -3.30% | |
| Price / MA100: | +5.40% | |
| Price / MAexp7: | -1.15% | |
| Price / MAexp20: | -2.91% | |
| Price / MAexp50: | -5.44% | |
| Price / MAexp100: | -7.64% |
News
The latest news and videos published on ROKU INC. at the time of the analysis were as follows:
- Roku Founder & CEO to Participate in Fireside Chat Hosted by Morgan Stanley
- Roku Chief Financial Officer to Present at BMO’s Digital Advertising Summit
- Roku Announces Industry-First Advertising Watermark to Protect from Ad Spoofing
- Roku Joins Sound Hub Denmark
- Multi-Award-Winning Australian Drama “The Newsreader” to Premiere in the United States Exclusively on The Roku Channel as a Roku Original on March 18
About author

Online


Add a comment
Comments
0 comments on the analysis ROKU INC. - 1H