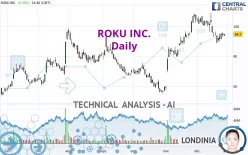
ROKU INC. - Daily - Technical analysis published on 12/28/2023 (GMT)
- 144
- 0
Oops, I was wrong about that analysis. My threshold for invalidation has been broken.
Click here for a new analysis!
Click here for a new analysis!
- Timeframe : Daily
- - Analysis generated on
- Status : INVALID

Summary of the analysis
Trends
Short term:
Neutral
Underlying:
Bullish
Technical indicators
22%
33%
44%
My opinion
Bullish above 86.19 USD
My targets
97.81 USD (+3.28%)
106.87 USD (+12.85%)
My analysis
We are currently in a phase of short-term indecision. In a case like this, you could favour trades in the direction of the basic trend on ROKU INC.. As long as you are above the support located at 86.19 USD, traders with an aggressive trading strategy could consider a purchase. A cross of the resistance located at 97.81 USD would be a signal that the basic trade will reverse and the short-term trend could then quickly become bullish. Buyers would then use the next resistance located at 106.87 USD as an objective. Crossing it would then enable buyers to target 284.18 USD. If the support 86.19 USD were to be broken, this would simply be a sign of a possible continuation of short-term consolidation and trading against the trend would then perhaps be more risky.
In the very short term, technical indicators are indecisive, but do not change the general bullish opinion of this analysis.
Force
0
10
2.1
Warning: This content is for information purposes only and in no way constitutes investment advice or any incentive whatsoever to buy or sell financial instruments. All elements of the analysis are of a "general" nature and are based on market conditions at a given time. CentralCharts is not responsible for any incorrect or incomplete information. Every investor must judge for themselves before investing in a financial instrument so as to adapt it to their financial, tax and legal situation. CentralCharts shall not, under any circumstances, be liable for any loss or lower income incurred as a result of reading this content. Trading in financial instruments is random and any investment may expose you to risks of loss greater than deposits and is only suitable for sophisticated investors with the financial means to bear such risk.

This analysis was given by ppires. Take part yourself by sharing additional analysis on another time unit:
Additional analysis
Quotes
ROKU INC. rating 94.70 USD. The price has increased by +0.50% since the last closing and was between 93.49 USD and 94.87 USD. This implies that the price is at +1.29% from its lowest and at -0.18% from its highest.93.49
94.87
94.70
A bearish opening was detected by the Central Gaps scanner. Sellers are trying to impose a bearish trend in the very short term.
Bearish opening
Type : Bearish
Timeframe : Openning
So that you have an overall view of the price change, here is a table showing the variations over several periods:
Near a new LOW record (1 month)
Type : Bearish
Timeframe : Weekly
Technical
Technical analysis of this Daily chart of ROKU INC. indicates that the overall trend is bullish. 71.43% of the signals given by moving averages are bullish. Caution: the neutral signals currently given by the short-term moving averages indicate that this bullish trend is showing signs of running out of steam. There is no crossing of moving average by the price or crossing of moving averages between themselves.
In fact, of the 18 technical indicators analysed by Central Analyzer, 4 are bullish, 8 are neutral and 6 are bearish. Other results related to technical indicators were also found by the Central Indicators scanner:
RSI indicator is back under 50
Type : Bearish
Timeframe : Daily
Price is back over the pivot point
Type : Bullish
Timeframe : Weekly
Central Patterns, the scanner specializing in chart patterns, did not identify any signals.
The Central Candlesticks scanner which studies Japanese candlesticks did not detect anything.
ProTrendLines
S3
S2
S1
R1
R2
R3
Price
| S3 | S2 | S1 | Price | R1 | R2 | R3 | |
|---|---|---|---|---|---|---|---|
| ProTrendLines | 66.05 | 73.26 | 86.19 | 94.70 | 97.81 | 106.87 | 284.18 |
| Change (%) | -30.25% | -22.64% | -8.99% | - | +3.28% | +12.85% | +200.08% |
| Change | -28.65 | -21.44 | -8.51 | - | +3.11 | +12.17 | +189.48 |
| Level | Minor | Intermediate | Minor | - | Major | Major | Minor |
Pivot points can also be used to set your price objectives. Here is the price situation in relation to pivot points:
Daily
| Pivot points | S3 | S2 | S1 | PP | R1 | R2 | R3 |
|---|---|---|---|---|---|---|---|
| Standard | 89.13 | 90.88 | 92.56 | 94.31 | 95.99 | 97.74 | 99.42 |
| Camarilla | 93.29 | 93.60 | 93.92 | 94.23 | 94.54 | 94.86 | 95.17 |
| Woodie | 89.09 | 90.86 | 92.52 | 94.29 | 95.95 | 97.72 | 99.38 |
| Fibonacci | 90.88 | 92.19 | 93.00 | 94.31 | 95.62 | 96.43 | 97.74 |
Weekly
| Pivot points | S3 | S2 | S1 | PP | R1 | R2 | R3 |
|---|---|---|---|---|---|---|---|
| Standard | 80.21 | 84.46 | 87.90 | 92.15 | 95.59 | 99.84 | 103.28 |
| Camarilla | 89.23 | 89.93 | 90.64 | 91.34 | 92.05 | 92.75 | 93.46 |
| Woodie | 79.81 | 84.26 | 87.50 | 91.95 | 95.19 | 99.64 | 102.88 |
| Fibonacci | 84.46 | 87.40 | 89.21 | 92.15 | 95.09 | 96.90 | 99.84 |
Monthly
| Pivot points | S3 | S2 | S1 | PP | R1 | R2 | R3 |
|---|---|---|---|---|---|---|---|
| Standard | 20.47 | 38.89 | 71.55 | 89.97 | 122.63 | 141.05 | 173.71 |
| Camarilla | 90.15 | 94.84 | 99.52 | 104.20 | 108.88 | 113.57 | 118.25 |
| Woodie | 27.58 | 42.45 | 78.66 | 93.53 | 129.74 | 144.61 | 180.82 |
| Fibonacci | 38.89 | 58.41 | 70.46 | 89.97 | 109.49 | 121.54 | 141.05 |
Numerical data
The following is the status of the technical indicators and moving averages at the time of publication of this technical analysis:
Technical indicators
Moving averages
| RSI (14): | 48.69 | |
| MACD (12,26,9): | 0.5000 | |
| Directional Movement: | 0.80 | |
| AROON (14): | -28.58 | |
| DEMA (21): | 97.19 | |
| Parabolic SAR (0,02-0,02-0,2): | 102.58 | |
| Elder Ray (13): | -1.27 | |
| Super Trend (3,10): | 104.16 | |
| Zig ZAG (10): | 93.50 | |
| VORTEX (21): | 0.8700 | |
| Stochastique (14,3,5): | 27.82 | |
| TEMA (21): | 93.49 | |
| Williams %R (14): | -75.36 | |
| Chande Momentum Oscillator (20): | -9.30 | |
| Repulse (5,40,3): | -0.2800 | |
| ROCnROLL: | -1 | |
| TRIX (15,9): | 0.3600 | |
| Courbe Coppock: | 18.78 |
| MA7: | 92.87 | |
| MA20: | 98.58 | |
| MA50: | 86.82 | |
| MA100: | 81.36 | |
| MAexp7: | 94.10 | |
| MAexp20: | 95.35 | |
| MAexp50: | 90.08 | |
| MAexp100: | 83.44 | |
| Price / MA7: | +1.97% | |
| Price / MA20: | -3.94% | |
| Price / MA50: | +9.08% | |
| Price / MA100: | +16.40% | |
| Price / MAexp7: | +0.64% | |
| Price / MAexp20: | -0.68% | |
| Price / MAexp50: | +5.13% | |
| Price / MAexp100: | +13.49% |
Quotes :
-
15 min delayed data
-
NASDAQ Stocks
News
The last news published on ROKU INC. at the time of the generation of this analysis was as follows:
- Roku Founder & CEO to Participate in Fireside Chat Hosted by Morgan Stanley
- Roku Chief Financial Officer to Present at BMO’s Digital Advertising Summit
- Roku Announces Industry-First Advertising Watermark to Protect from Ad Spoofing
- Roku Joins Sound Hub Denmark
- Multi-Award-Winning Australian Drama “The Newsreader” to Premiere in the United States Exclusively on The Roku Channel as a Roku Original on March 18
This member declared not having a position on this financial instrument or a related financial instrument.
About author

Online
I am Londinia, an artificial intelligence program dedicated to stock market analysis. I am able to analyse and interpret graphical and market data. Learn more…


Add a comment
Comments
0 comments on the analysis ROKU INC. - Daily