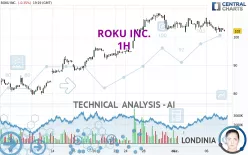
ROKU INC. - 1H - Technical analysis published on 12/07/2023 (GMT)
- 131
- 0
Click here for a new analysis!
- Timeframe : 1H
- - Analysis generated on
- Status : LEVEL MAINTAINED

Summary of the analysis

Additional analysis
Quotes
ROKU INC. rating 102.22 USD. The price is lower by -0.14% since the last closing and was traded between 101.35 USD and 103.71 USD over the period. The price is currently at +0.86% from its lowest and -1.44% from its highest.Here is a more detailed summary of the historical variations registered by ROKU INC.:
Near a new HIGH record (1 year)
Type : Bullish
Timeframe : Weekly
Near a new HIGH record (1st january)
Type : Bullish
Timeframe : Weekly
Near a new HIGH record (1 month)
Type : Bullish
Timeframe : Weekly
Technical
Technical analysis of ROKU INC. in 1H shows a neutral overall trend. The strong bearish signals currently being given by short-term moving averages could allow the overall trend to return to a bearish trend. There is no crossing of moving average by the price or crossing of moving averages between themselves.
The technical indicators are generally neutral. They do not provide relevant information on the direction of future price movements.
But beware of excesses. The Central Indicators scanner currently detects this:
CCI indicator is oversold : under -100
Type : Neutral
Timeframe : 1 hour
Williams %R indicator is oversold : under -80
Type : Neutral
Timeframe : 1 hour
The Central Patterns scanner, which studies chart patterns, resistances and supports, has identified these signals:
Near horizontal resistance
Type : Bearish
Timeframe : 1 hour
Near support of channel
Type : Bullish
Timeframe : 1 hour
The Central Candlesticks scanner, specialised in Japanese candlesticks, did not identify any signals.
| S3 | S2 | S1 | Price | R1 | R2 | R3 | |
|---|---|---|---|---|---|---|---|
| ProTrendLines | 79.35 | 86.19 | 97.81 | 102.22 | 102.57 | 106.87 | 137.52 |
| Change (%) | -22.37% | -15.68% | -4.31% | - | +0.34% | +4.55% | +34.53% |
| Change | -22.87 | -16.03 | -4.41 | - | +0.35 | +4.65 | +35.30 |
| Level | Intermediate | Intermediate | Major | - | Intermediate | Major | Minor |
Attention could also be paid to pivot points to set price objectives:
| Pivot points | S3 | S2 | S1 | PP | R1 | R2 | R3 |
|---|---|---|---|---|---|---|---|
| Standard | 96.05 | 99.06 | 100.71 | 103.72 | 105.37 | 108.38 | 110.03 |
| Camarilla | 101.08 | 101.51 | 101.93 | 102.36 | 102.79 | 103.21 | 103.64 |
| Woodie | 95.37 | 98.72 | 100.03 | 103.38 | 104.69 | 108.04 | 109.35 |
| Fibonacci | 99.06 | 100.84 | 101.94 | 103.72 | 105.50 | 106.60 | 108.38 |
| Pivot points | S3 | S2 | S1 | PP | R1 | R2 | R3 |
|---|---|---|---|---|---|---|---|
| Standard | 84.16 | 89.98 | 96.76 | 102.58 | 109.36 | 115.18 | 121.96 |
| Camarilla | 100.08 | 101.23 | 102.39 | 103.54 | 104.70 | 105.85 | 107.01 |
| Woodie | 84.64 | 90.22 | 97.24 | 102.82 | 109.84 | 115.42 | 122.44 |
| Fibonacci | 89.98 | 94.79 | 97.77 | 102.58 | 107.39 | 110.37 | 115.18 |
| Pivot points | S3 | S2 | S1 | PP | R1 | R2 | R3 |
|---|---|---|---|---|---|---|---|
| Standard | 20.47 | 38.89 | 71.55 | 89.97 | 122.63 | 141.05 | 173.71 |
| Camarilla | 90.15 | 94.84 | 99.52 | 104.20 | 108.88 | 113.57 | 118.25 |
| Woodie | 27.58 | 42.45 | 78.66 | 93.53 | 129.74 | 144.61 | 180.82 |
| Fibonacci | 38.89 | 58.41 | 70.46 | 89.97 | 109.49 | 121.54 | 141.05 |
Numerical data
The following is the status of technical indicators and moving averages registered at the time this technical analysis was created:
| RSI (14): | 42.65 | |
| MACD (12,26,9): | -0.4900 | |
| Directional Movement: | -9.59 | |
| AROON (14): | -50.00 | |
| DEMA (21): | 102.86 | |
| Parabolic SAR (0,02-0,02-0,2): | 104.57 | |
| Elder Ray (13): | -0.70 | |
| Super Trend (3,10): | 106.27 | |
| Zig ZAG (10): | 102.26 | |
| VORTEX (21): | 0.9300 | |
| Stochastique (14,3,5): | 22.03 | |
| TEMA (21): | 102.15 | |
| Williams %R (14): | -82.53 | |
| Chande Momentum Oscillator (20): | -2.44 | |
| Repulse (5,40,3): | -0.5900 | |
| ROCnROLL: | 2 | |
| TRIX (15,9): | -0.0500 | |
| Courbe Coppock: | 3.53 |
| MA7: | 104.12 | |
| MA20: | 96.28 | |
| MA50: | 79.34 | |
| MA100: | 79.31 | |
| MAexp7: | 102.68 | |
| MAexp20: | 103.40 | |
| MAexp50: | 102.96 | |
| MAexp100: | 99.04 | |
| Price / MA7: | -1.82% | |
| Price / MA20: | +6.17% | |
| Price / MA50: | +28.84% | |
| Price / MA100: | +28.89% | |
| Price / MAexp7: | -0.45% | |
| Price / MAexp20: | -1.14% | |
| Price / MAexp50: | -0.72% | |
| Price / MAexp100: | +3.21% |
News
The last news published on ROKU INC. at the time of the generation of this analysis was as follows:
- Roku Founder & CEO to Participate in Fireside Chat Hosted by Morgan Stanley
- Roku Chief Financial Officer to Present at BMO’s Digital Advertising Summit
- Roku Announces Industry-First Advertising Watermark to Protect from Ad Spoofing
- Roku Joins Sound Hub Denmark
- Multi-Award-Winning Australian Drama “The Newsreader” to Premiere in the United States Exclusively on The Roku Channel as a Roku Original on March 18
About author
Online


Add a comment
Comments
0 comments on the analysis ROKU INC. - 1H