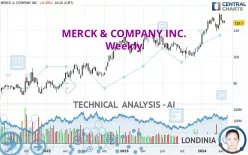
MERCK & COMPANY INC. - Weekly - Technical analysis published on 04/16/2024 (GMT)
- 150
- 0
Click here for a new analysis!
- Timeframe : Weekly
- - Analysis generated on
- Status : INVALID

Summary of the analysis

Additional analysis
Quotes
The MERCK & COMPANY INC. price is 125.70 USD. Over 5 days, this instrument lost -0.80% and has been traded over the last 5 days between 125.10 USD and 127.11 USD. This implies that the 5 day price is +0.48% from its lowest point and -1.11% from its highest point.The Central Gaps scanner detects a bullish opening marking the presence of buyers ahead of sellers at the opening but not sufficiently marked to allow the price to register a quotation gap.
Bullish opening
Type : Bullish
Timeframe : Openning
So that you have an overall view of the price change, here is a table showing the variations over several periods:
Near a new HIGH record (5 years)
Type : Bullish
Timeframe : Weekly
Near a new HIGH record (1 year)
Type : Bullish
Timeframe : Weekly
Near a new HIGH record (1st january)
Type : Bullish
Timeframe : Weekly
Near a new HIGH record (1 month)
Type : Bullish
Timeframe : Weekly
Technical
Technical analysis of MERCK & COMPANY INC. in Weekly shows a strongly overall bullish trend. 92.86% of the signals given by moving averages are bullish. The overall trend is supported by the strong bullish signals from short-term moving averages. There is no crossing of moving average by the price or crossing of moving averages between themselves.
In fact, according to the parameters integrated into the Central Analyzer system, 11 technical indicators out of 18 analysed are currently bullish. Central Indicators, the scanner specialised in technical indicators, has identified this signal:
Price is back under the pivot point
Type : Bearish
Timeframe : Weekly
An analysis of the price chart with the Central Patterns scanner (detector of chart patterns and resistances and supports) shows a result that can have an impact on the price change:
Near horizontal resistance
Type : Bearish
Timeframe : Weekly
No result was found by the Central Candlesticks scanner on Japanese candlesticks.
| S3 | S2 | S1 | Price | R1 | |
|---|---|---|---|---|---|
| ProTrendLines | 77.60 | 98.86 | 116.00 | 125.70 | 128.63 |
| Change (%) | -38.27% | -21.35% | -7.72% | - | +2.33% |
| Change | -48.10 | -26.84 | -9.70 | - | +2.93 |
| Level | Minor | Major | Major | - | Major |
Pivot points can also be used to set your price objectives. Here is the price situation in relation to pivot points:
| Pivot points | S3 | S2 | S1 | PP | R1 | R2 | R3 |
|---|---|---|---|---|---|---|---|
| Standard | 123.48 | 124.68 | 125.43 | 126.63 | 127.38 | 128.58 | 129.33 |
| Camarilla | 125.65 | 125.83 | 126.01 | 126.19 | 126.37 | 126.55 | 126.73 |
| Woodie | 123.27 | 124.57 | 125.22 | 126.52 | 127.17 | 128.47 | 129.12 |
| Fibonacci | 124.68 | 125.42 | 125.88 | 126.63 | 127.37 | 127.83 | 128.58 |
| Pivot points | S3 | S2 | S1 | PP | R1 | R2 | R3 |
|---|---|---|---|---|---|---|---|
| Standard | 121.68 | 123.37 | 124.55 | 126.24 | 127.42 | 129.11 | 130.29 |
| Camarilla | 124.95 | 125.21 | 125.48 | 125.74 | 126.00 | 126.27 | 126.53 |
| Woodie | 121.44 | 123.24 | 124.31 | 126.11 | 127.18 | 128.98 | 130.05 |
| Fibonacci | 123.37 | 124.46 | 125.14 | 126.24 | 127.33 | 128.01 | 129.11 |
| Pivot points | S3 | S2 | S1 | PP | R1 | R2 | R3 |
|---|---|---|---|---|---|---|---|
| Standard | 109.22 | 114.22 | 123.09 | 128.09 | 136.96 | 141.96 | 150.83 |
| Camarilla | 128.14 | 129.41 | 130.68 | 131.95 | 133.22 | 134.49 | 135.76 |
| Woodie | 111.15 | 115.19 | 125.02 | 129.06 | 138.89 | 142.93 | 152.76 |
| Fibonacci | 114.22 | 119.52 | 122.80 | 128.09 | 133.39 | 136.67 | 141.96 |
Numerical data
The following is the status of the technical indicators and moving averages at the time of publication of this technical analysis:
| RSI (14): | 61.47 | |
| MACD (12,26,9): | 5.2400 | |
| Directional Movement: | 16.04 | |
| AROON (14): | 78.57 | |
| DEMA (21): | 127.65 | |
| Parabolic SAR (0,02-0,02-0,2): | 120.05 | |
| Elder Ray (13): | 2.95 | |
| Super Trend (3,10): | 115.65 | |
| Zig ZAG (10): | 125.76 | |
| VORTEX (21): | 1.2800 | |
| Stochastique (14,3,5): | 65.23 | |
| TEMA (21): | 130.05 | |
| Williams %R (14): | -41.70 | |
| Chande Momentum Oscillator (20): | 5.81 | |
| Repulse (5,40,3): | -1.5900 | |
| ROCnROLL: | 1 | |
| TRIX (15,9): | 0.6800 | |
| Courbe Coppock: | 25.16 |
| MA7: | 126.27 | |
| MA20: | 126.94 | |
| MA50: | 125.69 | |
| MA100: | 118.12 | |
| MAexp7: | 125.90 | |
| MAexp20: | 120.89 | |
| MAexp50: | 113.30 | |
| MAexp100: | 105.03 | |
| Price / MA7: | -0.45% | |
| Price / MA20: | -0.98% | |
| Price / MA50: | +0.01% | |
| Price / MA100: | +6.42% | |
| Price / MAexp7: | -0.16% | |
| Price / MAexp20: | +3.98% | |
| Price / MAexp50: | +10.94% | |
| Price / MAexp100: | +19.68% |
News
Don't forget to follow the news on MERCK & COMPANY INC.. At the time of publication of this analysis, the latest news was as follows:
- How We Can Strengthen Vaccination Programs and Build Vaccine Confidence Together
- Merck Foundation Strengthens Its Commitment to Expanding Access to Care in Asia-Pacific Region
- Merck Is Inspiring Innovation Through Diversity and Inclusion
- The Wall Street Journal Names Merck Among Top 10 Best-Managed Companies
- Unexpected Inspiration for More Sustainable Drug Development at Merck
About author

Online


Add a comment
Comments
0 comments on the analysis MERCK & COMPANY INC. - Weekly