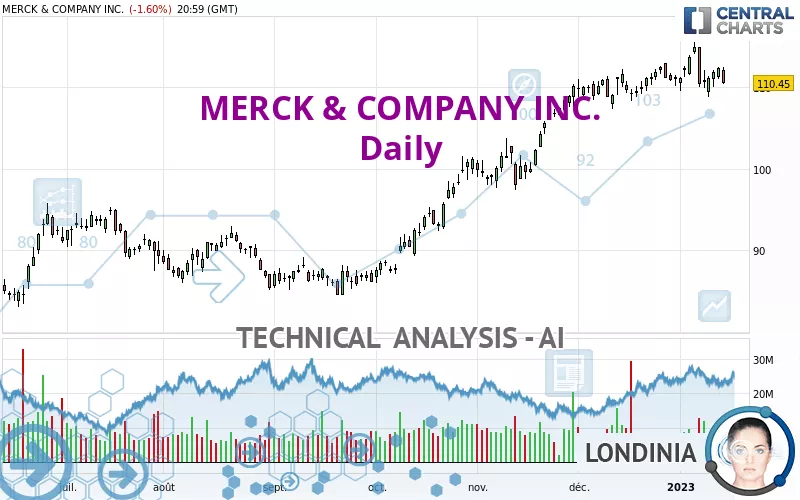
MERCK & COMPANY INC. - Daily - Technical analysis published on 01/17/2023 (GMT)
- 244
- 0
Click here for a new analysis!
- Timeframe : Daily
- - Analysis generated on
- Status : INVALID

Summary of the analysis

Additional analysis
Quotes
The MERCK & COMPANY INC. rating is 110.45 USD. On the day, this instrument lost -1.60% and was between 110.32 USD and 112.49 USD. This implies that the price is at +0.12% from its lowest and at -1.81% from its highest.The Central Gaps scanner detects a bearish opening. A small advantage for sellers in the very short term.
Bearish opening
Type : Bearish
Timeframe : Openning
Here is a more detailed summary of the historical variations registered by MERCK & COMPANY INC.:
Near a new HIGH record (5 years)
Type : Bullish
Timeframe : Weekly
Near a new HIGH record (1 year)
Type : Bullish
Timeframe : Weekly
Near a new HIGH record (1st january)
Type : Bullish
Timeframe : Weekly
Near a new HIGH record (1 month)
Type : Bullish
Timeframe : Weekly
Technical
Technical analysis of MERCK & COMPANY INC. in Daily shows an overall bullish trend. 75.00% of the signals given by moving averages are bullish. Caution: the neutral signals currently given by the short-term moving averages indicate that this bullish trend is showing signs of running out of steam. The Central Indicators scanner detects bearish signals on moving averages that could impact this trend:
Bearish price crossover with Moving Average 20
Type : Bearish
Timeframe : Daily
Bearish price crossover with adaptative moving average 50
Type : Bearish
Timeframe : Daily
An assessment of technical indicators does not currently provide any relevant information on the direction of future price movements.
Central Indicators, the detector scanner for these technical indicators has recently detected several signals:
Pivot points : price is under support 1
Type : Neutral
Timeframe : Daily
Price is back under the pivot point
Type : Bearish
Timeframe : Weekly
Momentum indicator is back under 0
Type : Bearish
Timeframe : Daily
Williams %R indicator is back under -50
Type : Bearish
Timeframe : Daily
The Central Patterns scanner, which studies chart patterns, resistances and supports, has identified these signals:
Near horizontal support
Type : Bullish
Timeframe : Daily
Support of channel is broken
Type : Bearish
Timeframe : Daily
The Central Candlesticks scanner which studies Japanese candlesticks did not detect anything.
| S3 | S2 | S1 | Price | R1 | |
|---|---|---|---|---|---|
| ProTrendLines | 93.58 | 97.32 | 110.38 | 110.45 | 114.84 |
| Change (%) | -15.27% | -11.89% | -0.06% | - | +3.97% |
| Change | -16.87 | -13.13 | -0.07 | - | +4.39 |
| Level | Major | Minor | Major | - | Major |
To determine price objectives, it is also possible to use the pivot points. Here is the price position in relation to pivot points:
| Pivot points | S3 | S2 | S1 | PP | R1 | R2 | R3 |
|---|---|---|---|---|---|---|---|
| Standard | 107.51 | 108.92 | 109.68 | 111.09 | 111.85 | 113.26 | 114.02 |
| Camarilla | 109.85 | 110.05 | 110.25 | 110.45 | 110.65 | 110.85 | 111.05 |
| Woodie | 107.20 | 108.76 | 109.37 | 110.93 | 111.54 | 113.10 | 113.71 |
| Fibonacci | 108.92 | 109.75 | 110.26 | 111.09 | 111.92 | 112.43 | 113.26 |
| Pivot points | S3 | S2 | S1 | PP | R1 | R2 | R3 |
|---|---|---|---|---|---|---|---|
| Standard | 102.84 | 105.80 | 109.02 | 111.98 | 115.20 | 118.16 | 121.38 |
| Camarilla | 110.55 | 111.12 | 111.68 | 112.25 | 112.82 | 113.38 | 113.95 |
| Woodie | 102.98 | 105.87 | 109.16 | 112.05 | 115.34 | 118.23 | 121.52 |
| Fibonacci | 105.80 | 108.16 | 109.62 | 111.98 | 114.34 | 115.80 | 118.16 |
| Pivot points | S3 | S2 | S1 | PP | R1 | R2 | R3 |
|---|---|---|---|---|---|---|---|
| Standard | 101.13 | 103.87 | 107.41 | 110.15 | 113.69 | 116.43 | 119.97 |
| Camarilla | 109.22 | 109.80 | 110.37 | 110.95 | 111.53 | 112.10 | 112.68 |
| Woodie | 101.53 | 104.07 | 107.81 | 110.35 | 114.09 | 116.63 | 120.37 |
| Fibonacci | 103.87 | 106.27 | 107.75 | 110.15 | 112.55 | 114.03 | 116.43 |
Numerical data
The following is the status of technical indicators and moving averages registered at the time this technical analysis was created:
| RSI (14): | 50.95 | |
| MACD (12,26,9): | 1.1100 | |
| Directional Movement: | -0.68 | |
| AROON (14): | -21.43 | |
| DEMA (21): | 112.71 | |
| Parabolic SAR (0,02-0,02-0,2): | 114.16 | |
| Elder Ray (13): | 0.02 | |
| Super Trend (3,10): | 109.73 | |
| Zig ZAG (10): | 110.45 | |
| VORTEX (21): | 0.9700 | |
| Stochastique (14,3,5): | 40.65 | |
| TEMA (21): | 111.67 | |
| Williams %R (14): | -74.78 | |
| Chande Momentum Oscillator (20): | -0.63 | |
| Repulse (5,40,3): | -0.4700 | |
| ROCnROLL: | -1 | |
| TRIX (15,9): | 0.2000 | |
| Courbe Coppock: | 1.50 |
| MA7: | 111.65 | |
| MA20: | 111.30 | |
| MA50: | 107.55 | |
| MA100: | 98.49 | |
| MAexp7: | 111.45 | |
| MAexp20: | 110.93 | |
| MAexp50: | 107.14 | |
| MAexp100: | 101.45 | |
| Price / MA7: | -1.07% | |
| Price / MA20: | -0.76% | |
| Price / MA50: | +2.70% | |
| Price / MA100: | +12.14% | |
| Price / MAexp7: | -0.90% | |
| Price / MAexp20: | -0.43% | |
| Price / MAexp50: | +3.09% | |
| Price / MAexp100: | +8.87% |
News
The latest news and videos published on MERCK & COMPANY INC. at the time of the analysis were as follows:
- How Merck Is Prioritizing Diversity in Clinical Trials and Why It's So Important
- Merck Video: What the “Great Resignation” Taught Us About Workplace Culture
- Merck Leaders Recognized As Influential Women Executives
- In Burkina Faso, a Personal Mission To Make a Difference in One Community
-
 Merck
Merck
About author

Online


Add a comment
Comments
0 comments on the analysis MERCK & COMPANY INC. - Daily