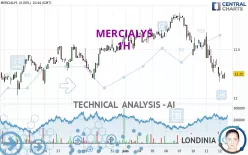
MERCIALYS - 1H - Technical analysis published on 06/12/2024 (GMT)
- 160
- 0
Click here for a new analysis!
- Timeframe : 1H
- - Analysis generated on
- Status : TARGET REACHED

Summary of the analysis

Additional analysis
Quotes
The MERCIALYS rating is 11.24 EUR. The price is lower by -0.09% since the last closing and was between 11.17 EUR and 11.28 EUR. This implies that the price is at +0.63% from its lowest and at -0.35% from its highest.The Central Gaps scanner detects a bearish opening. A small advantage for sellers in the very short term.
Bearish opening
Type : Bearish
Timeframe : Openning
Here is a more detailed summary of the historical variations registered by MERCIALYS:
Near a new HIGH record (5 years)
Type : Bullish
Timeframe : Weekly
Technical
Technical analysis of this 1H chart of MERCIALYS indicates that the overall trend is strongly bearish. The signals given by moving averages are 85.71% bearish. This strong bearish trend is confirmed by the strong signals currently being given by short-term moving averages. The Central Indicators scanner does not detect any result on moving averages that would impact this trend.
In fact, 12 technical indicators on 18 studied are currently bearish. Caution: the Central Indicators scanner currently detects an excess:
CCI indicator is oversold : under -100
Type : Neutral
Timeframe : 1 hour
Williams %R indicator is oversold : under -80
Type : Neutral
Timeframe : 1 hour
Pivot points : price is under support 3
Type : Neutral
Timeframe : Weekly
An analysis of the price chart with the Central Patterns scanner (detector of chart patterns and resistances and supports) shows several results that can have an impact on the price change:
Near horizontal support
Type : Bullish
Timeframe : 1 hour
Support of channel is broken
Type : Bearish
Timeframe : 1 hour
The Central Candlesticks scanner, specialised in Japanese candlesticks, did not identify any signals.
| S3 | S2 | S1 | Price | R1 | R2 | R3 | |
|---|---|---|---|---|---|---|---|
| ProTrendLines | 10.47 | 10.63 | 11.03 | 11.24 | 11.25 | 11.45 | 11.67 |
| Change (%) | -6.85% | -5.43% | -1.87% | - | +0.09% | +1.87% | +3.83% |
| Change | -0.77 | -0.61 | -0.21 | - | +0.01 | +0.21 | +0.43 |
| Level | Minor | Minor | Intermediate | - | Major | Major | Minor |
Pivot points can also be used to set your price objectives. Here is the price situation in relation to pivot points:
| Pivot points | S3 | S2 | S1 | PP | R1 | R2 | R3 |
|---|---|---|---|---|---|---|---|
| Standard | 10.64 | 10.93 | 11.09 | 11.38 | 11.54 | 11.83 | 11.99 |
| Camarilla | 11.13 | 11.17 | 11.21 | 11.25 | 11.29 | 11.33 | 11.37 |
| Woodie | 10.58 | 10.90 | 11.03 | 11.35 | 11.48 | 11.80 | 11.93 |
| Fibonacci | 10.93 | 11.10 | 11.21 | 11.38 | 11.55 | 11.66 | 11.83 |
| Pivot points | S3 | S2 | S1 | PP | R1 | R2 | R3 |
|---|---|---|---|---|---|---|---|
| Standard | 11.05 | 11.28 | 11.42 | 11.65 | 11.79 | 12.02 | 12.16 |
| Camarilla | 11.47 | 11.50 | 11.54 | 11.57 | 11.60 | 11.64 | 11.67 |
| Woodie | 11.02 | 11.26 | 11.39 | 11.63 | 11.76 | 12.00 | 12.13 |
| Fibonacci | 11.28 | 11.42 | 11.51 | 11.65 | 11.79 | 11.88 | 12.02 |
| Pivot points | S3 | S2 | S1 | PP | R1 | R2 | R3 |
|---|---|---|---|---|---|---|---|
| Standard | 9.10 | 9.60 | 10.62 | 11.12 | 12.14 | 12.64 | 13.66 |
| Camarilla | 11.21 | 11.35 | 11.49 | 11.63 | 11.77 | 11.91 | 12.05 |
| Woodie | 9.35 | 9.73 | 10.87 | 11.25 | 12.39 | 12.77 | 13.91 |
| Fibonacci | 9.60 | 10.18 | 10.54 | 11.12 | 11.70 | 12.06 | 12.64 |
Numerical data
The following are the details of the technical indicators and moving averages that were collected to generate this technical analysis:
| RSI (14): | 34.14 | |
| MACD (12,26,9): | -0.1000 | |
| Directional Movement: | -22.95 | |
| AROON (14): | -64.28 | |
| DEMA (21): | 11.25 | |
| Parabolic SAR (0,02-0,02-0,2): | 11.45 | |
| Elder Ray (13): | -0.11 | |
| Super Trend (3,10): | 11.47 | |
| Zig ZAG (10): | 11.24 | |
| VORTEX (21): | 0.8300 | |
| Stochastique (14,3,5): | 12.00 | |
| TEMA (21): | 11.19 | |
| Williams %R (14): | -86.00 | |
| Chande Momentum Oscillator (20): | -0.17 | |
| Repulse (5,40,3): | -0.0400 | |
| ROCnROLL: | 2 | |
| TRIX (15,9): | -0.1200 | |
| Courbe Coppock: | 4.60 |
| MA7: | 11.54 | |
| MA20: | 11.43 | |
| MA50: | 10.61 | |
| MA100: | 10.06 | |
| MAexp7: | 11.27 | |
| MAexp20: | 11.38 | |
| MAexp50: | 11.50 | |
| MAexp100: | 11.48 | |
| Price / MA7: | -2.60% | |
| Price / MA20: | -1.66% | |
| Price / MA50: | +5.94% | |
| Price / MA100: | +11.73% | |
| Price / MAexp7: | -0.27% | |
| Price / MAexp20: | -1.23% | |
| Price / MAexp50: | -2.26% | |
| Price / MAexp100: | -2.09% |
News
Don't forget to follow the news on MERCIALYS. At the time of publication of this analysis, the latest news was as follows:
- Mercialys: Number of Outstanding Shares and Voting Rights as of July 31, 2023
- Statement on the availability of Mercialys 2023 half-year financial report
- Mercialys: 2023 First-Half Results
- Half-year Review of Mercialys’ Liquidity Agreement
- Mercialys Becomes the Leading Shareholder in DEPUR Alongside Its Founder by Investing Euro 1.1 million in the Euro 1.7 Million Round of Fundraising Carried out by the DEPUR Experiences Group
About author
Online


Add a comment
Comments
0 comments on the analysis MERCIALYS - 1H