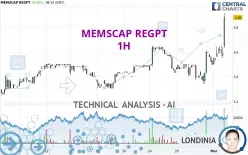
MEMSCAP REGPT - 1H - Technical analysis published on 03/04/2025 (GMT)
- 107
- 0
Click here for a new analysis!
- Timeframe : 1H
- - Analysis generated on
- Status : TARGET REACHED

Summary of the analysis

Additional analysis
Quotes
The MEMSCAP REGPT rating is 3.880 EUR. The price registered an increase of +8.08% on the session and was between 3.630 EUR and 3.915 EUR. This implies that the price is at +6.89% from its lowest and at -0.89% from its highest.A bullish opening was detected by the Central Gaps scanner. Buyers are trying to impose a bullish momentum in the very short term.
Bullish opening
Type : Bullish
Timeframe : Openning
So that you have an overall view of the price change, here is a table showing the variations over several periods:
Near a new HIGH record (1 month)
Type : Bullish
Timeframe : Weekly
Technical
Technical analysis of MEMSCAP REGPT in 1H shows a strongly overall bullish trend. The signals given by the moving averages are 89.29% bullish. This strong bullish trend is confirmed by the strong signals currently being given by short-term moving averages. The Central Indicators scanner does not detect any result on moving averages that would impact this trend.
In fact, 16 technical indicators on 18 studied are currently bullish. Caution: the Central Indicators scanner currently detects an excess:
RSI indicator is overbought : over 70
Type : Neutral
Timeframe : 1 hour
CCI indicator is overbought : over 100
Type : Neutral
Timeframe : 1 hour
Williams %R indicator is overbought : over -20
Type : Neutral
Timeframe : 1 hour
Pivot points : price is over resistance 1
Type : Neutral
Timeframe : Weekly
Pivot points : price is over resistance 2
Type : Neutral
Timeframe : 1 hour
The Central Patterns scanner, which studies chart patterns, resistances and supports, has identified this signal:
Near resistance of channel
Type : Bearish
Timeframe : 1 hour
The Central Candlesticks scanner, specialised in Japanese candlesticks, did not identify any signals.
| S3 | S2 | S1 | Price | R1 | R2 | R3 | |
|---|---|---|---|---|---|---|---|
| ProTrendLines | 3.502 | 3.657 | 3.800 | 3.880 | 3.890 | 4.344 | 5.213 |
| Change (%) | -9.74% | -5.75% | -2.06% | - | +0.26% | +11.96% | +34.36% |
| Change | -0.378 | -0.223 | -0.080 | - | +0.010 | +0.464 | +1.333 |
| Level | Major | Intermediate | Minor | - | Minor | Intermediate | Major |
To determine price objectives, it is also possible to use the pivot points. Here is the price position in relation to pivot points:
| Pivot points | S3 | S2 | S1 | PP | R1 | R2 | R3 |
|---|---|---|---|---|---|---|---|
| Standard | 3.360 | 3.430 | 3.510 | 3.580 | 3.660 | 3.730 | 3.810 |
| Camarilla | 3.549 | 3.563 | 3.576 | 3.590 | 3.604 | 3.618 | 3.631 |
| Woodie | 3.365 | 3.433 | 3.515 | 3.583 | 3.665 | 3.733 | 3.815 |
| Fibonacci | 3.430 | 3.487 | 3.523 | 3.580 | 3.637 | 3.673 | 3.730 |
| Pivot points | S3 | S2 | S1 | PP | R1 | R2 | R3 |
|---|---|---|---|---|---|---|---|
| Standard | 3.030 | 3.185 | 3.340 | 3.495 | 3.650 | 3.805 | 3.960 |
| Camarilla | 3.410 | 3.438 | 3.467 | 3.495 | 3.523 | 3.552 | 3.580 |
| Woodie | 3.030 | 3.185 | 3.340 | 3.495 | 3.650 | 3.805 | 3.960 |
| Fibonacci | 3.185 | 3.303 | 3.377 | 3.495 | 3.613 | 3.687 | 3.805 |
| Pivot points | S3 | S2 | S1 | PP | R1 | R2 | R3 |
|---|---|---|---|---|---|---|---|
| Standard | 2.818 | 3.022 | 3.258 | 3.462 | 3.698 | 3.902 | 4.138 |
| Camarilla | 3.374 | 3.414 | 3.455 | 3.495 | 3.535 | 3.576 | 3.616 |
| Woodie | 2.835 | 3.030 | 3.275 | 3.470 | 3.715 | 3.910 | 4.155 |
| Fibonacci | 3.022 | 3.190 | 3.294 | 3.462 | 3.630 | 3.734 | 3.902 |
Numerical data
The following is the status of technical indicators and moving averages registered at the time this technical analysis was created:
| RSI (14): | 65.00 | |
| MACD (12,26,9): | 0.0370 | |
| Directional Movement: | 16.191 | |
| AROON (14): | 100.000 | |
| DEMA (21): | 3.598 | |
| Parabolic SAR (0,02-0,02-0,2): | 3.440 | |
| Elder Ray (13): | 0.108 | |
| Super Trend (3,10): | 3.489 | |
| Zig ZAG (10): | 3.790 | |
| VORTEX (21): | 1.0650 | |
| Stochastique (14,3,5): | 88.71 | |
| TEMA (21): | 3.657 | |
| Williams %R (14): | 0.00 | |
| Chande Momentum Oscillator (20): | 0.200 | |
| Repulse (5,40,3): | 5.4940 | |
| ROCnROLL: | 1 | |
| TRIX (15,9): | 0.0940 | |
| Courbe Coppock: | 10.52 |
| MA7: | 3.571 | |
| MA20: | 3.452 | |
| MA50: | 4.097 | |
| MA100: | 4.031 | |
| MAexp7: | 3.661 | |
| MAexp20: | 3.547 | |
| MAexp50: | 3.517 | |
| MAexp100: | 3.516 | |
| Price / MA7: | +8.65% | |
| Price / MA20: | +12.40% | |
| Price / MA50: | -5.30% | |
| Price / MA100: | -3.75% | |
| Price / MAexp7: | +5.98% | |
| Price / MAexp20: | +9.39% | |
| Price / MAexp50: | +10.32% | |
| Price / MAexp100: | +10.35% |
News
The last news published on MEMSCAP REGPT at the time of the generation of this analysis was as follows:
- MEMSCAP: Financial Calendar
- MEMSCAP – Q4 2024
- MEMSCAP Confirms Its Eligibility for French PEA-PME Savings Plans
- MEMSCAP – Q2 2023: Profitability Rise Driven by Group's Business Growth
- MEMSCAP: Minutes of the Annual Ordinary and Extraordinary Shareholders’ Meeting of May 31, 2023
About author
Online


Add a comment
Comments
0 comments on the analysis MEMSCAP REGPT - 1H