MEMSCAP REGPT - 1H - Technical analysis published on 10/09/2024 (GMT)
- 123
- 0
Click here for a new analysis!
- Timeframe : 1H
- - Analysis generated on
- Status : TARGET REACHED

Summary of the analysis

Additional analysis
Quotes
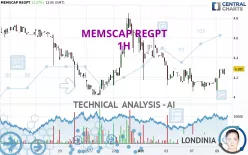
The MEMSCAP REGPT price is 4.285 EUR. On the day, this instrument gained +2.27% and was between 4.070 EUR and 4.285 EUR. This implies that the price is at +5.28% from its lowest and at 0% from its highest.A bearish opening was detected by the Central Gaps scanner. Sellers are trying to impose a bearish trend in the very short term.
Bearish opening
Type : Bearish
Timeframe : Openning
A study of price movements over other periods shows the following variations:
Near a new LOW record (1st january)
Type : Bearish
Timeframe : Weekly
Near a new LOW record (1 month)
Type : Bearish
Timeframe : Weekly
Technical
Technical analysis of MEMSCAP REGPT in 1H shows an overall slightly bearish trend. 53.57% of the signals given by moving averages are bearish. Caution: the strong bullish signals currently being given by short-term moving averages could quickly lead to a reversal of the trend. The Central Indicators market scanner is currently detecting several bullish signals that could impact this trend:
Bullish price crossover with Moving Average 50
Type : Bullish
Timeframe : 1 hour
Bullish price crossover with Moving Average 100
Type : Bullish
Timeframe : 1 hour
Bullish price crossover with adaptative moving average 20
Type : Bullish
Timeframe : 1 hour
Bullish price crossover with adaptative moving average 100
Type : Bullish
Timeframe : 1 hour
Technical indicators are strongly bullish, suggesting that the price increase should continue.
But beware of excesses. The Central Indicators scanner currently detects this:
CCI indicator is overbought : over 100
Type : Neutral
Timeframe : 1 hour
Williams %R indicator is overbought : over -20
Type : Neutral
Timeframe : 1 hour
Pivot points : price is over resistance 2
Type : Neutral
Timeframe : 1 hour
An analysis of the price chart with the Central Patterns scanner (detector of chart patterns and resistances and supports) shows a result that can have an impact on the price change:
Resistance of channel is broken
Type : Bullish
Timeframe : 1 hour
The presence of a bullish Japanese candlestick pattern detected by Central Candlesticks that could cause a very short term rebound was also detected:
Bullish engulfing lines
Type : Bullish
Timeframe : 1 hour
| S3 | S2 | S1 | Price | R1 | R2 | R3 | |
|---|---|---|---|---|---|---|---|
| ProTrendLines | 1.398 | 2.701 | 4.020 | 4.285 | 4.344 | 4.607 | 4.853 |
| Change (%) | -67.37% | -36.97% | -6.18% | - | +1.38% | +7.51% | +13.26% |
| Change | -2.887 | -1.584 | -0.265 | - | +0.059 | +0.322 | +0.568 |
| Level | Intermediate | Intermediate | Intermediate | - | Major | Major | Intermediate |
Attention could also be paid to pivot points to set price objectives:
| Pivot points | S3 | S2 | S1 | PP | R1 | R2 | R3 |
|---|---|---|---|---|---|---|---|
| Standard | 3.983 | 4.027 | 4.108 | 4.152 | 4.233 | 4.277 | 4.358 |
| Camarilla | 4.156 | 4.167 | 4.179 | 4.190 | 4.202 | 4.213 | 4.224 |
| Woodie | 4.003 | 4.036 | 4.128 | 4.161 | 4.253 | 4.286 | 4.378 |
| Fibonacci | 4.027 | 4.074 | 4.104 | 4.152 | 4.199 | 4.229 | 4.277 |
| Pivot points | S3 | S2 | S1 | PP | R1 | R2 | R3 |
|---|---|---|---|---|---|---|---|
| Standard | 3.263 | 3.692 | 3.993 | 4.422 | 4.723 | 5.152 | 5.453 |
| Camarilla | 4.094 | 4.161 | 4.228 | 4.295 | 4.362 | 4.429 | 4.496 |
| Woodie | 3.200 | 3.660 | 3.930 | 4.390 | 4.660 | 5.120 | 5.390 |
| Fibonacci | 3.692 | 3.971 | 4.143 | 4.422 | 4.701 | 4.873 | 5.152 |
| Pivot points | S3 | S2 | S1 | PP | R1 | R2 | R3 |
|---|---|---|---|---|---|---|---|
| Standard | 0.747 | 2.383 | 3.507 | 5.143 | 6.267 | 7.903 | 9.027 |
| Camarilla | 3.871 | 4.124 | 4.377 | 4.630 | 4.883 | 5.136 | 5.389 |
| Woodie | 0.490 | 2.255 | 3.250 | 5.015 | 6.010 | 7.775 | 8.770 |
| Fibonacci | 2.383 | 3.438 | 4.089 | 5.143 | 6.198 | 6.849 | 7.903 |
Numerical data
The following is the status of technical indicators and moving averages registered at the time this technical analysis was created:
| RSI (14): | 58.85 | |
| MACD (12,26,9): | 0.0090 | |
| Directional Movement: | -11.557 | |
| AROON (14): | 85.714 | |
| DEMA (21): | 4.202 | |
| Parabolic SAR (0,02-0,02-0,2): | 4.077 | |
| Elder Ray (13): | 0.045 | |
| Super Trend (3,10): | 4.151 | |
| Zig ZAG (10): | 4.285 | |
| VORTEX (21): | 1.0890 | |
| Stochastique (14,3,5): | 93.02 | |
| TEMA (21): | 4.244 | |
| Williams %R (14): | 0.00 | |
| Chande Momentum Oscillator (20): | 0.175 | |
| Repulse (5,40,3): | 2.2170 | |
| ROCnROLL: | 1 | |
| TRIX (15,9): | -0.0550 | |
| Courbe Coppock: | 4.52 |
| MA7: | 4.276 | |
| MA20: | 4.422 | |
| MA50: | 5.377 | |
| MA100: | 6.088 | |
| MAexp7: | 4.239 | |
| MAexp20: | 4.204 | |
| MAexp50: | 4.241 | |
| MAexp100: | 4.349 | |
| Price / MA7: | +0.21% | |
| Price / MA20: | -3.10% | |
| Price / MA50: | -20.31% | |
| Price / MA100: | -29.62% | |
| Price / MAexp7: | +1.09% | |
| Price / MAexp20: | +1.93% | |
| Price / MAexp50: | +1.04% | |
| Price / MAexp100: | -1.47% |
News
The last news published on MEMSCAP REGPT at the time of the generation of this analysis was as follows:
- MEMSCAP – Q2 2023: Profitability Rise Driven by Group's Business Growth
- MEMSCAP: Minutes of the Annual Ordinary and Extraordinary Shareholders’ Meeting of May 31, 2023
- MEGGITT Selects MEMSCAP for Engine Monitoring Systems
- MEMSCAP Unveils Its New Website
- MEMSCAP - Q1 2023 : Strong Profitable Growth as Targeted by the 4G Plan
About author
Online


Add a comment
Comments
0 comments on the analysis MEMSCAP REGPT - 1H