BIOTECHNOLOGY - Daily - Technical analysis published on 12/09/2022 (GMT)
- 225
- 0
Click here for a new analysis!
- Timeframe : Daily
- - Analysis generated on
- Status : INVALID
Summary of the analysis

Additional analysis
Quotes
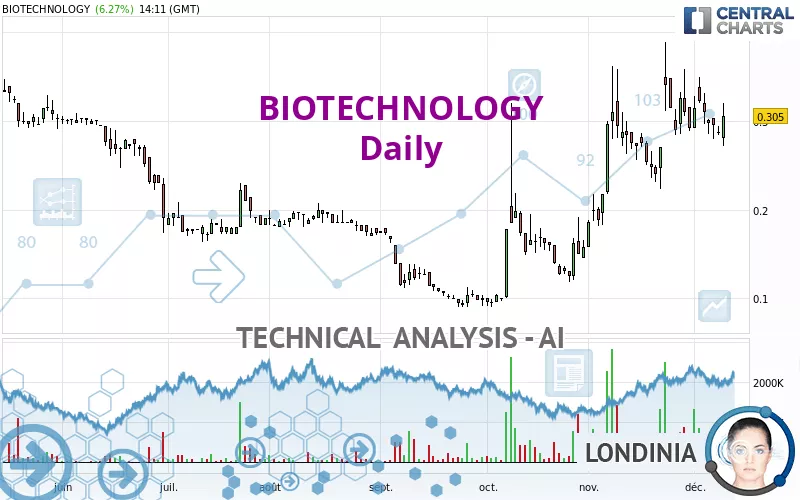
BIOTECHNOLOGY rating 0.3050 EUR. The price has increased by +6.27% since the last closing and was traded between 0.2720 EUR and 0.3200 EUR over the period. The price is currently at +12.13% from its lowest and -4.69% from its highest.The Central Gaps scanner detects a bearish gap which is a sign that the sellers have taken the lead in the very short term.
Opening Gap DOWN
Type : Bearish
Timeframe : Openning
A study of price movements over other periods shows the following variations:
Abnormal volumes
Timeframe : 5 days
Abnormal volumes
Timeframe : 20 days
Abnormal volumes
Timeframe : 50 days
Technical
A technical analysis in Daily of this BIOTECHNOLOGY chart shows a strongly bullish trend. 92.86% of the signals given by moving averages are bullish. The overall trend is supported by the strong bullish signals from short-term moving averages. The Central Indicators market scanner is currently detecting a bullish signal that could impact this trend:
Bullish price crossover with Moving Average 20
Type : Bullish
Timeframe : Daily
An assessment of technical indicators does not currently provide any relevant information to suggest whether the signal given by the technical indicators is more bullish or bearish.
Other results related to technical indicators were also found by the Central Indicators scanner:
Pivot points : price is over resistance 3
Type : Neutral
Timeframe : Daily
Momentum indicator is back under 0
Type : Bearish
Timeframe : Daily
Williams %R indicator is back over -50
Type : Bullish
Timeframe : Daily
The analysis of the price chart with Central Patterns scanners does not return any result.
The Central Candlesticks scanner which studies Japanese candlesticks did not detect anything.
| S3 | S2 | S1 | Price | R1 | R2 | R3 | |
|---|---|---|---|---|---|---|---|
| ProTrendLines | 0.1250 | 0.1725 | 0.2400 | 0.3050 | 0.3107 | 0.3410 | 0.3790 |
| Change (%) | -59.02% | -43.44% | -21.31% | - | +1.87% | +11.80% | +24.26% |
| Change | -0.1800 | -0.1325 | -0.0650 | - | +0.0057 | +0.0360 | +0.0740 |
| Level | Minor | Intermediate | Major | - | Intermediate | Major | Major |
Pivot points can also be used to set your price objectives. Here is the price situation in relation to pivot points:
| Pivot points | S3 | S2 | S1 | PP | R1 | R2 | R3 |
|---|---|---|---|---|---|---|---|
| Standard | 0.2727 | 0.2783 | 0.2827 | 0.2883 | 0.2927 | 0.2983 | 0.3027 |
| Camarilla | 0.2843 | 0.2852 | 0.2861 | 0.2870 | 0.2879 | 0.2888 | 0.2898 |
| Woodie | 0.2720 | 0.2780 | 0.2820 | 0.2880 | 0.2920 | 0.2980 | 0.3020 |
| Fibonacci | 0.2783 | 0.2822 | 0.2845 | 0.2883 | 0.2922 | 0.2945 | 0.2983 |
| Pivot points | S3 | S2 | S1 | PP | R1 | R2 | R3 |
|---|---|---|---|---|---|---|---|
| Standard | 0.2132 | 0.2493 | 0.2857 | 0.3218 | 0.3582 | 0.3943 | 0.4307 |
| Camarilla | 0.3021 | 0.3087 | 0.3154 | 0.3220 | 0.3287 | 0.3353 | 0.3419 |
| Woodie | 0.2133 | 0.2494 | 0.2858 | 0.3219 | 0.3583 | 0.3944 | 0.4308 |
| Fibonacci | 0.2493 | 0.2770 | 0.2941 | 0.3218 | 0.3495 | 0.3666 | 0.3943 |
| Pivot points | S3 | S2 | S1 | PP | R1 | R2 | R3 |
|---|---|---|---|---|---|---|---|
| Standard | -0.0607 | 0.0487 | 0.1703 | 0.2797 | 0.4013 | 0.5107 | 0.6323 |
| Camarilla | 0.2285 | 0.2497 | 0.2708 | 0.2920 | 0.3132 | 0.3344 | 0.3555 |
| Woodie | -0.0545 | 0.0518 | 0.1765 | 0.2828 | 0.4075 | 0.5138 | 0.6385 |
| Fibonacci | 0.0487 | 0.1369 | 0.1914 | 0.2797 | 0.3679 | 0.4224 | 0.5107 |
Numerical data
The following is the status of the technical indicators and moving averages at the time of publication of this technical analysis:
| RSI (14): | 56.87 | |
| MACD (12,26,9): | 0.0213 | |
| Directional Movement: | 20.3810 | |
| AROON (14): | 7.1428 | |
| DEMA (21): | 0.3188 | |
| Parabolic SAR (0,02-0,02-0,2): | 0.3785 | |
| Elder Ray (13): | -0.0010 | |
| Super Trend (3,10): | 0.2239 | |
| Zig ZAG (10): | 0.3050 | |
| VORTEX (21): | 0.9249 | |
| Stochastique (14,3,5): | 43.78 | |
| TEMA (21): | 0.3144 | |
| Williams %R (14): | -50.60 | |
| Chande Momentum Oscillator (20): | -0.0360 | |
| Repulse (5,40,3): | 6.5983 | |
| ROCnROLL: | 1 | |
| TRIX (15,9): | 1.6706 | |
| Courbe Coppock: | 23.71 |
| MA7: | 0.3045 | |
| MA20: | 0.2920 | |
| MA50: | 0.2240 | |
| MA100: | 0.1910 | |
| MAexp7: | 0.3005 | |
| MAexp20: | 0.2869 | |
| MAexp50: | 0.2443 | |
| MAexp100: | 0.2286 | |
| Price / MA7: | +0.16% | |
| Price / MA20: | +4.45% | |
| Price / MA50: | +36.16% | |
| Price / MA100: | +59.69% | |
| Price / MAexp7: | +1.50% | |
| Price / MAexp20: | +6.31% | |
| Price / MAexp50: | +24.85% | |
| Price / MAexp100: | +33.42% |
News
Don't forget to follow the news on BIOTECHNOLOGY. At the time of publication of this analysis, the latest news was as follows:
- In a New Audio Interview, Toni Loudenbeck of Traders News Source Interviews Dr. Frank Bedu-Addo, CEO PDS Biotechnology Corporation
- LIXTE Biotechnology Holdings to Present at Planet MicroCap Showcase: VIRTUAL 2022 Investor Conference
- MAIA Biotechnology Announces Establishment of Rule 10b5-1 Trading Plan
- MAIA Biotechnology Presents Preclinical Data at SITC Annual Meeting Validating Efficacy of THIO in Treating Hepatocellular Carcinoma
- ImaginAb Executes License and Supply Agreement for CD8 ImmunoPET Technology with DynamiCure Biotechnology
About author
Online


Add a comment
Comments
0 comments on the analysis BIOTECHNOLOGY - Daily