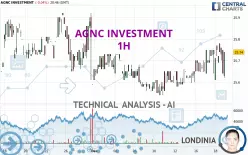
AGNC INVESTMENT - 1H - Technical analysis published on 12/18/2024 (GMT)
- 95
- 0
Click here for a new analysis!
- Timeframe : 1H
- - Analysis generated on
- Status : INVALID

Summary of the analysis

Additional analysis
Quotes
The AGNC INVESTMENT rating is 25.74 USD. On the day, this instrument lost -0.04% and was between 25.61 USD and 25.78 USD. This implies that the price is at +0.51% from its lowest and at -0.16% from its highest.The Central Gaps scanner detects a bearish gap which is a sign that the sellers have taken the lead in the very short term.
Opening Gap DOWN
Type : Bearish
Timeframe : Openning
A study of price movements over other periods shows the following variations:
Near a new HIGH record (5 years)
Type : Bullish
Timeframe : Weekly
Near a new HIGH record (1 year)
Type : Bullish
Timeframe : Weekly
Near a new HIGH record (1st january)
Type : Bullish
Timeframe : Weekly
Near a new HIGH record (1 month)
Type : Bullish
Timeframe : Weekly
Technical
Technical analysis of this 1H chart of AGNC INVESTMENT indicates that the overall trend is slightly bullish. 53.57% of the signals given by moving averages are bullish. The overall trend remains fragile, as do the slightly bullish signals given by short-term moving averages. The Central Indicators market scanner is currently detecting several bearish signals that could impact this trend:
Bearish trend reversal : Moving Average 100
Type : Bearish
Timeframe : 1 hour
Bearish trend reversal : adaptative moving average 20
Type : Bearish
Timeframe : 1 hour
Bearish trend reversal : adaptative moving average 50
Type : Bearish
Timeframe : 1 hour
Bearish trend reversal : adaptative moving average 100
Type : Bearish
Timeframe : 1 hour
An assessment of technical indicators does not currently provide any relevant information to suggest whether the signal given by the technical indicators is more bullish or bearish.
Caution: the Central Indicators scanner currently detects an excess:
CCI indicator is oversold : under -100
Type : Neutral
Timeframe : 1 hour
Pivot points : price is under support 1
Type : Neutral
Timeframe : 1 hour
Parabolic SAR indicator bearish reversal
Type : Bearish
Timeframe : 1 hour
Central Patterns, the scanner specializing in chart patterns, did not identify any signals.
Central Candlesticks, the scanner specialised in Japanese candlesticks, detects a bullish signal that could support the hypothesis of a small rebound in the very short term:
Bullish doji star
Type : Bullish
Timeframe : 1 hour
| S3 | S2 | S1 | Price | R1 | R2 | R3 | |
|---|---|---|---|---|---|---|---|
| ProTrendLines | 25.52 | 25.64 | 25.73 | 25.74 | 25.81 | 25.89 | 26.00 |
| Change (%) | -0.85% | -0.39% | -0.04% | - | +0.27% | +0.58% | +1.01% |
| Change | -0.22 | -0.10 | -0.01 | - | +0.07 | +0.15 | +0.26 |
| Level | Intermediate | Major | Intermediate | - | Minor | Major | Major |
Pivot points can also be used to set your price objectives. Here is the price situation in relation to pivot points:
| Pivot points | S3 | S2 | S1 | PP | R1 | R2 | R3 |
|---|---|---|---|---|---|---|---|
| Standard | 25.57 | 25.60 | 25.68 | 25.71 | 25.79 | 25.82 | 25.90 |
| Camarilla | 25.72 | 25.73 | 25.74 | 25.75 | 25.76 | 25.77 | 25.78 |
| Woodie | 25.59 | 25.61 | 25.70 | 25.72 | 25.81 | 25.83 | 25.92 |
| Fibonacci | 25.60 | 25.65 | 25.67 | 25.71 | 25.76 | 25.78 | 25.82 |
| Pivot points | S3 | S2 | S1 | PP | R1 | R2 | R3 |
|---|---|---|---|---|---|---|---|
| Standard | 25.45 | 25.49 | 25.57 | 25.61 | 25.69 | 25.73 | 25.81 |
| Camarilla | 25.61 | 25.62 | 25.63 | 25.64 | 25.65 | 25.66 | 25.67 |
| Woodie | 25.46 | 25.50 | 25.58 | 25.62 | 25.70 | 25.74 | 25.82 |
| Fibonacci | 25.49 | 25.54 | 25.57 | 25.61 | 25.66 | 25.69 | 25.73 |
| Pivot points | S3 | S2 | S1 | PP | R1 | R2 | R3 |
|---|---|---|---|---|---|---|---|
| Standard | 24.90 | 25.21 | 25.40 | 25.71 | 25.90 | 26.21 | 26.40 |
| Camarilla | 25.45 | 25.50 | 25.54 | 25.59 | 25.64 | 25.68 | 25.73 |
| Woodie | 24.84 | 25.18 | 25.34 | 25.68 | 25.84 | 26.18 | 26.34 |
| Fibonacci | 25.21 | 25.40 | 25.52 | 25.71 | 25.90 | 26.02 | 26.21 |
Numerical data
The following are the details of the technical indicators and moving averages that were collected to generate this technical analysis:
| RSI (14): | 45.78 | |
| MACD (12,26,9): | 0.0100 | |
| Directional Movement: | -5.54 | |
| AROON (14): | 21.43 | |
| DEMA (21): | 25.71 | |
| Parabolic SAR (0,02-0,02-0,2): | 25.78 | |
| Elder Ray (13): | -0.07 | |
| Super Trend (3,10): | 25.59 | |
| Zig ZAG (10): | 25.65 | |
| VORTEX (21): | 0.8500 | |
| Stochastique (14,3,5): | 36.69 | |
| TEMA (21): | 25.71 | |
| Williams %R (14): | -76.46 | |
| Chande Momentum Oscillator (20): | -0.10 | |
| Repulse (5,40,3): | -0.3000 | |
| ROCnROLL: | 2 | |
| TRIX (15,9): | 0.0100 | |
| Courbe Coppock: | 0.26 |
| MA7: | 25.64 | |
| MA20: | 25.67 | |
| MA50: | 25.66 | |
| MA100: | 25.39 | |
| MAexp7: | 25.69 | |
| MAexp20: | 25.69 | |
| MAexp50: | 25.67 | |
| MAexp100: | 25.67 | |
| Price / MA7: | +0.39% | |
| Price / MA20: | +0.27% | |
| Price / MA50: | +0.31% | |
| Price / MA100: | +1.38% | |
| Price / MAexp7: | +0.19% | |
| Price / MAexp20: | +0.19% | |
| Price / MAexp50: | +0.27% | |
| Price / MAexp100: | +0.27% |
About author
Online


Add a comment
Comments
0 comments on the analysis AGNC INVESTMENT - 1H