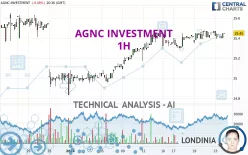
AGNC INVESTMENT - 1H - Technical analysis published on 01/23/2024 (GMT)
- 207
- 0
Click here for a new analysis!
- Timeframe : 1H
- - Analysis generated on
- Status : TARGET REACHED

Summary of the analysis

Additional analysis
Quotes
The AGNC INVESTMENT price is 25.44 USD. The price registered a decrease of -0.12% on the session with the lowest point at 25.39 USD and the highest point at 25.47 USD. The deviation from the price is +0.20% for the low point and -0.12% for the high point.So that you have an overall view of the price change, here is a table showing the variations over several periods:
New HIGH record (5 years)
Type : Bullish
Timeframe : Weekly
New HIGH record (1 year)
Type : Bullish
Timeframe : Weekly
New HIGH record (1st january)
Type : Bullish
Timeframe : Weekly
New HIGH record (1 month)
Type : Bullish
Timeframe : Weekly
Technical
Technical analysis of AGNC INVESTMENT in 1H shows a strongly overall bullish trend. 85.71% of the signals given by moving averages are bullish. The slightly bullish signals given by the short-term moving averages show a weakening of the global trend. The Central Indicators market scanner is currently detecting a bullish signal that could impact this trend:
Bullish trend reversal : adaptative moving average 20
Type : Bullish
Timeframe : 1 hour
Technical indicators are slightly bullish. There is therefore considerable uncertainty about the continuation of the increase.
Other results related to technical indicators were also found by the Central Indicators scanner:
Aroon indicator bearish trend
Type : Bearish
Timeframe : 1 hour
Price is back under the pivot point
Type : Bearish
Timeframe : 1 hour
Central Patterns, the market scanner focusing on chart patterns, resistances and supports found these results:
Near horizontal support
Type : Bullish
Timeframe : 1 hour
Support of channel is broken
Type : Bearish
Timeframe : 1 hour
Central Candlesticks, the scanner specialised in Japanese candlesticks, detects these bearish signals that could support the hypothesis of a small drop in the very short term:
Bearish harami
Type : Bearish
Timeframe : 1 hour
Bearish harami cross
Type : Bearish
Timeframe : 1 hour
| S3 | S2 | S1 | Price | R1 | |
|---|---|---|---|---|---|
| ProTrendLines | 24.68 | 24.96 | 25.08 | 25.44 | 25.45 |
| Change (%) | -2.99% | -1.89% | -1.42% | - | +0.04% |
| Change | -0.76 | -0.48 | -0.36 | - | +0.01 |
| Level | Intermediate | Major | Intermediate | - | Intermediate |
To determine price objectives, it is also possible to use the pivot points. Here is the price position in relation to pivot points:
| Pivot points | S3 | S2 | S1 | PP | R1 | R2 | R3 |
|---|---|---|---|---|---|---|---|
| Standard | 25.35 | 25.38 | 25.42 | 25.45 | 25.49 | 25.52 | 25.56 |
| Camarilla | 25.45 | 25.46 | 25.46 | 25.47 | 25.48 | 25.48 | 25.49 |
| Woodie | 25.37 | 25.38 | 25.44 | 25.45 | 25.51 | 25.52 | 25.58 |
| Fibonacci | 25.38 | 25.40 | 25.42 | 25.45 | 25.47 | 25.49 | 25.52 |
| Pivot points | S3 | S2 | S1 | PP | R1 | R2 | R3 |
|---|---|---|---|---|---|---|---|
| Standard | 25.19 | 25.25 | 25.35 | 25.41 | 25.51 | 25.57 | 25.67 |
| Camarilla | 25.42 | 25.43 | 25.45 | 25.46 | 25.48 | 25.49 | 25.50 |
| Woodie | 25.22 | 25.26 | 25.38 | 25.42 | 25.54 | 25.58 | 25.70 |
| Fibonacci | 25.25 | 25.31 | 25.35 | 25.41 | 25.47 | 25.51 | 25.57 |
| Pivot points | S3 | S2 | S1 | PP | R1 | R2 | R3 |
|---|---|---|---|---|---|---|---|
| Standard | 23.88 | 24.18 | 24.50 | 24.80 | 25.12 | 25.42 | 25.74 |
| Camarilla | 24.66 | 24.72 | 24.77 | 24.83 | 24.89 | 24.94 | 25.00 |
| Woodie | 23.90 | 24.19 | 24.52 | 24.81 | 25.14 | 25.43 | 25.76 |
| Fibonacci | 24.18 | 24.41 | 24.56 | 24.80 | 25.03 | 25.18 | 25.42 |
Numerical data
The following is the status of the technical indicators and moving averages at the time of publication of this technical analysis:
| RSI (14): | 53.49 | |
| MACD (12,26,9): | 0.0100 | |
| Directional Movement: | -8.51 | |
| AROON (14): | -64.29 | |
| DEMA (21): | 25.45 | |
| Parabolic SAR (0,02-0,02-0,2): | 25.46 | |
| Elder Ray (13): | 0.01 | |
| Super Trend (3,10): | 25.34 | |
| Zig ZAG (10): | 25.44 | |
| VORTEX (21): | 1.0400 | |
| Stochastique (14,3,5): | 58.33 | |
| TEMA (21): | 25.44 | |
| Williams %R (14): | -37.50 | |
| Chande Momentum Oscillator (20): | -0.03 | |
| Repulse (5,40,3): | 0.2500 | |
| ROCnROLL: | 1 | |
| TRIX (15,9): | 0.0100 | |
| Courbe Coppock: | 0.00 |
| MA7: | 25.43 | |
| MA20: | 25.18 | |
| MA50: | 24.82 | |
| MA100: | 24.59 | |
| MAexp7: | 25.44 | |
| MAexp20: | 25.43 | |
| MAexp50: | 25.38 | |
| MAexp100: | 25.27 | |
| Price / MA7: | +0.04% | |
| Price / MA20: | +1.03% | |
| Price / MA50: | +2.50% | |
| Price / MA100: | +3.46% | |
| Price / MAexp7: | -0% | |
| Price / MAexp20: | +0.04% | |
| Price / MAexp50: | +0.24% | |
| Price / MAexp100: | +0.67% |
About author
Online


Add a comment
Comments
0 comments on the analysis AGNC INVESTMENT - 1H