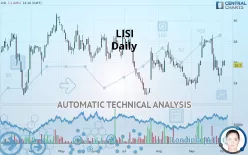
LISI - Daily - Technical analysis published on 10/02/2019 (GMT)
- 260
- 0
- Who voted?
Click here for a new analysis!
- Timeframe : Daily
- - Analysis generated on
- Status : TARGET REACHED

Summary of the analysis

Additional analysis
Quotes
The LISI price is 25.70 EUR. The price is lower by -1.34% since the last closing with the lowest point at 25.60 EUR and the highest point at 26.20 EUR. The deviation from the price is +0.39% for the low point and -1.91% for the high point.Here is a more detailed summary of the historical variations registered by LISI:
Technical
Technical analysis of this Daily chart of LISI indicates that the overall trend is bearish. 71.43% of the signals given by moving averages are bearish. The overall trend seems to be showing some signs of weakness, as do the tentative bearish signals from short-term moving averages. An assessment of moving averages reveals several bullish signals that could impact this trend:
Bullish price crossover with Moving Average 50
Type : Bullish
Timeframe : Daily
Bullish price crossover with adaptative moving average 20
Type : Bullish
Timeframe : Daily
Bullish price crossover with adaptative moving average 50
Type : Bullish
Timeframe : Daily
The technical indicators are generally neutral. They do not provide relevant information on the direction of future price movements.
Caution: the Central Indicators scanner currently detects an excess:
Williams %R indicator is overbought : over -20
Type : Neutral
Timeframe : Daily
RSI indicator is back over 50
Type : Bullish
Timeframe : Daily
Ichimoku : price is over the cloud
Type : Bullish
Timeframe : Daily
Price is back over the pivot point
Type : Bullish
Timeframe : Daily
Price is back under the pivot point
Type : Bearish
Timeframe : Weekly
Central Patterns, the market scanner focusing on chart patterns, resistances and supports found these results:
Near horizontal resistance
Type : Bearish
Timeframe : Daily
Near support of channel
Type : Bullish
Timeframe : Daily
Near support of triangle
Type : Bullish
Timeframe : Daily
For a small rebound in the very short term, the Central Candlesticks scanner currently notes the presence of this bullish pattern in Japanese candlesticks:
Upside gap
Type : Bullish
Timeframe : Daily
| S3 | S2 | S1 | Price | R1 | R2 | R3 | |
|---|---|---|---|---|---|---|---|
| ProTrendLines | 18.81 | 22.89 | 24.87 | 25.70 | 25.87 | 29.04 | 30.50 |
| Change (%) | -26.81% | -10.93% | -3.23% | - | +0.66% | +13.00% | +18.68% |
| Change | -6.89 | -2.81 | -0.83 | - | +0.17 | +3.34 | +4.80 |
| Level | Major | Major | Intermediate | - | Major | Major | Minor |
To determine price objectives, it is also possible to use the pivot points. Here is the price position in relation to pivot points:
| Pivot points | S3 | S2 | S1 | PP | R1 | R2 | R3 |
|---|---|---|---|---|---|---|---|
| Standard | 25.00 | 25.25 | 25.65 | 25.90 | 26.30 | 26.55 | 26.95 |
| Camarilla | 25.87 | 25.93 | 25.99 | 26.05 | 26.11 | 26.17 | 26.23 |
| Woodie | 25.08 | 25.29 | 25.73 | 25.94 | 26.38 | 26.59 | 27.03 |
| Fibonacci | 25.25 | 25.50 | 25.65 | 25.90 | 26.15 | 26.30 | 26.55 |
| Pivot points | S3 | S2 | S1 | PP | R1 | R2 | R3 |
|---|---|---|---|---|---|---|---|
| Standard | 20.15 | 22.10 | 23.45 | 25.40 | 26.75 | 28.70 | 30.05 |
| Camarilla | 23.89 | 24.20 | 24.50 | 24.80 | 25.10 | 25.41 | 25.71 |
| Woodie | 19.85 | 21.95 | 23.15 | 25.25 | 26.45 | 28.55 | 29.75 |
| Fibonacci | 22.10 | 23.36 | 24.14 | 25.40 | 26.66 | 27.44 | 28.70 |
| Pivot points | S3 | S2 | S1 | PP | R1 | R2 | R3 |
|---|---|---|---|---|---|---|---|
| Standard | 17.80 | 20.60 | 23.00 | 25.80 | 28.20 | 31.00 | 33.40 |
| Camarilla | 23.97 | 24.45 | 24.92 | 25.40 | 25.88 | 26.35 | 26.83 |
| Woodie | 17.60 | 20.50 | 22.80 | 25.70 | 28.00 | 30.90 | 33.20 |
| Fibonacci | 20.60 | 22.59 | 23.81 | 25.80 | 27.79 | 29.01 | 31.00 |
Numerical data
The following are the details of the technical indicators and moving averages that were collected to generate this technical analysis:
| RSI (14): | 49.67 | |
| MACD (12,26,9): | -0.0200 | |
| Directional Movement: | -1.75 | |
| AROON (14): | -35.71 | |
| DEMA (21): | 25.97 | |
| Parabolic SAR (0,02-0,02-0,2): | 27.59 | |
| Elder Ray (13): | 0.01 | |
| Super Trend (3,10): | 27.26 | |
| Zig ZAG (10): | 25.85 | |
| VORTEX (21): | 1.0400 | |
| Stochastique (14,3,5): | 37.73 | |
| TEMA (21): | 25.86 | |
| Williams %R (14): | -60.44 | |
| Chande Momentum Oscillator (20): | -2.10 | |
| Repulse (5,40,3): | 0.7200 | |
| ROCnROLL: | 2 | |
| TRIX (15,9): | 0.1000 | |
| Courbe Coppock: | 6.05 |
| MA7: | 25.44 | |
| MA20: | 26.28 | |
| MA50: | 25.79 | |
| MA100: | 26.24 | |
| MAexp7: | 25.70 | |
| MAexp20: | 25.92 | |
| MAexp50: | 25.89 | |
| MAexp100: | 26.05 | |
| Price / MA7: | +1.02% | |
| Price / MA20: | -2.21% | |
| Price / MA50: | -0.35% | |
| Price / MA100: | -2.06% | |
| Price / MAexp7: | -0% | |
| Price / MAexp20: | -0.85% | |
| Price / MAexp50: | -0.73% | |
| Price / MAexp100: | -1.34% |
News
The last news published on LISI at the time of the generation of this analysis was as follows:
 LISI
LISIAbout author

Online


Add a comment
Comments
0 comments on the analysis LISI - Daily