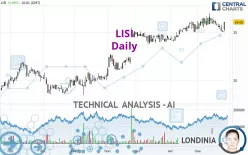
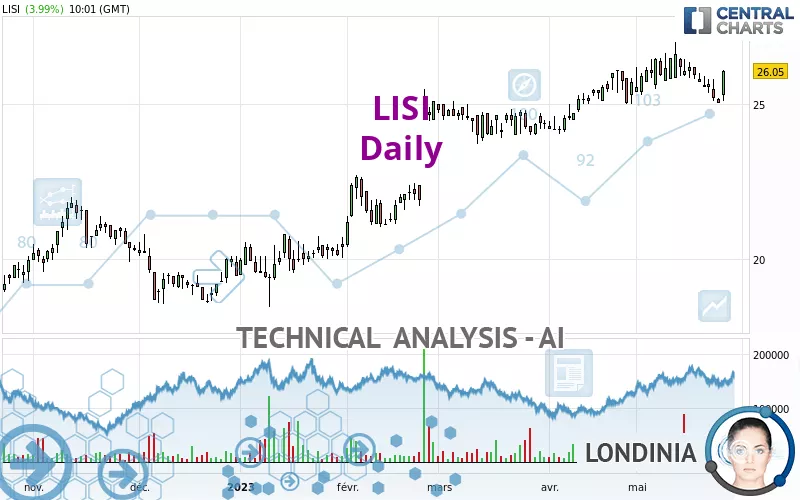
LISI - Daily - Technical analysis published on 05/26/2023 (GMT)
- 234
- 0
Click here for a new analysis!
- Timeframe : Daily
- - Analysis generated on
- Status : INVALID
Summary of the analysis

Additional analysis
Quotes
LISI rating 26.05 EUR. The price registered an increase of +3.99% on the session with the lowest point at 25.10 EUR and the highest point at 26.10 EUR. The deviation from the price is +3.78% for the low point and -0.19% for the high point.A bullish gap was detected at the opening by the Central Gaps scanner. There are a lot of buyers and they have the upper hand in the very short term.
Opening Gap UP
Type : Bullish
Timeframe : Openning
A study of price movements over other periods shows the following variations:
Near a new HIGH record (1 year)
Type : Bullish
Timeframe : Weekly
Near a new HIGH record (1st january)
Type : Bullish
Timeframe : Weekly
Near a new HIGH record (1 month)
Type : Bullish
Timeframe : Weekly
Technical
A technical analysis in Daily of this LISI chart shows a strongly bullish trend. 92.86% of the signals given by moving averages are bullish. The overall trend is supported by the strong bullish signals from short-term moving averages. The Central Indicators market scanner is currently detecting several bullish signals that could impact this trend:
Bullish price crossover with Moving Average 20
Type : Bullish
Timeframe : Daily
Bullish price crossover with Moving Average 50
Type : Bullish
Timeframe : Daily
Bullish price crossover with adaptative moving average 20
Type : Bullish
Timeframe : Daily
Bullish price crossover with adaptative moving average 50
Type : Bullish
Timeframe : Daily
An assessment of technical indicators does not currently provide any relevant information to suggest whether the signal given by the technical indicators is more bullish or bearish.
But beware of excesses. The Central Indicators scanner currently detects this:
Previous candle closed under Bollinger bands
Type : Neutral
Timeframe : Daily
Pivot points : price is over resistance 3
Type : Neutral
Timeframe : Daily
RSI indicator is back over 50
Type : Bullish
Timeframe : Daily
Price is back over the pivot point
Type : Bullish
Timeframe : Weekly
Williams %R indicator is back over -50
Type : Bullish
Timeframe : Daily
Central Patterns, the scanner specializing in chart patterns, did not identify any signals.
For a small rebound in the very short term, the Central Candlesticks scanner currently notes the presence of this bullish pattern in Japanese candlesticks:
White morning star
Type : Bullish
Timeframe : Daily
| S3 | S2 | S1 | Price | R1 | R2 | R3 | |
|---|---|---|---|---|---|---|---|
| ProTrendLines | 21.67 | 23.01 | 24.97 | 26.05 | 26.30 | 27.87 | 29.84 |
| Change (%) | -16.81% | -11.67% | -4.15% | - | +0.96% | +6.99% | +14.55% |
| Change | -4.38 | -3.04 | -1.08 | - | +0.25 | +1.82 | +3.79 |
| Level | Minor | Major | Major | - | Major | Minor | Major |
Pivot points can also be used to set your price objectives. Here is the price situation in relation to pivot points:
| Pivot points | S3 | S2 | S1 | PP | R1 | R2 | R3 |
|---|---|---|---|---|---|---|---|
| Standard | 24.85 | 24.95 | 25.00 | 25.10 | 25.15 | 25.25 | 25.30 |
| Camarilla | 25.01 | 25.02 | 25.04 | 25.05 | 25.06 | 25.08 | 25.09 |
| Woodie | 24.83 | 24.94 | 24.98 | 25.09 | 25.13 | 25.24 | 25.28 |
| Fibonacci | 24.95 | 25.01 | 25.04 | 25.10 | 25.16 | 25.19 | 25.25 |
| Pivot points | S3 | S2 | S1 | PP | R1 | R2 | R3 |
|---|---|---|---|---|---|---|---|
| Standard | 24.63 | 25.17 | 25.43 | 25.97 | 26.23 | 26.77 | 27.03 |
| Camarilla | 25.48 | 25.55 | 25.63 | 25.70 | 25.77 | 25.85 | 25.92 |
| Woodie | 24.50 | 25.10 | 25.30 | 25.90 | 26.10 | 26.70 | 26.90 |
| Fibonacci | 25.17 | 25.47 | 25.66 | 25.97 | 26.27 | 26.46 | 26.77 |
| Pivot points | S3 | S2 | S1 | PP | R1 | R2 | R3 |
|---|---|---|---|---|---|---|---|
| Standard | 22.18 | 23.05 | 24.37 | 25.24 | 26.56 | 27.43 | 28.75 |
| Camarilla | 25.10 | 25.30 | 25.50 | 25.70 | 25.90 | 26.10 | 26.30 |
| Woodie | 22.42 | 23.16 | 24.61 | 25.35 | 26.80 | 27.54 | 28.99 |
| Fibonacci | 23.05 | 23.88 | 24.40 | 25.24 | 26.07 | 26.59 | 27.43 |
Numerical data
The following are the details of the technical indicators and moving averages that were collected to generate this technical analysis:
| RSI (14): | 55.45 | |
| MACD (12,26,9): | 0.1000 | |
| Directional Movement: | 10.17 | |
| AROON (14): | -64.29 | |
| DEMA (21): | 25.93 | |
| Parabolic SAR (0,02-0,02-0,2): | 26.24 | |
| Elder Ray (13): | -0.14 | |
| Super Trend (3,10): | 24.43 | |
| Zig ZAG (10): | 26.05 | |
| VORTEX (21): | 0.9600 | |
| Stochastique (14,3,5): | 18.85 | |
| TEMA (21): | 25.65 | |
| Williams %R (14): | -48.72 | |
| Chande Momentum Oscillator (20): | -0.10 | |
| Repulse (5,40,3): | 2.7300 | |
| ROCnROLL: | 1 | |
| TRIX (15,9): | 0.1300 | |
| Courbe Coppock: | 2.97 |
| MA7: | 25.59 | |
| MA20: | 25.93 | |
| MA50: | 25.18 | |
| MA100: | 23.42 | |
| MAexp7: | 25.66 | |
| MAexp20: | 25.72 | |
| MAexp50: | 25.07 | |
| MAexp100: | 23.86 | |
| Price / MA7: | +1.80% | |
| Price / MA20: | +0.46% | |
| Price / MA50: | +3.46% | |
| Price / MA100: | +11.23% | |
| Price / MAexp7: | +1.52% | |
| Price / MAexp20: | +1.28% | |
| Price / MAexp50: | +3.91% | |
| Price / MAexp100: | +9.18% |
News
The latest news and videos published on LISI at the time of the analysis were as follows:
About author
Online


Add a comment
Comments
0 comments on the analysis LISI - Daily