RIGETTI COMPUTING INC. - 1H - Technical analysis published on 01/02/2025 (GMT)
- 137
- 0
I am delighted to see that my first price objective has been achieved. I hope you've taken advantage of it.
Click here for a new analysis!
Click here for a new analysis!
- Timeframe : 1H
- - Analysis generated on
- Status : TARGET REACHED
Summary of the analysis
Trends
Short term:
Neutral
Underlying:
Bullish
Technical indicators
17%
39%
44%
My opinion
Bullish above 12.05 USD
My targets
15.59 USD (+2.16%)
18.24 USD (+19.53%)
My analysis
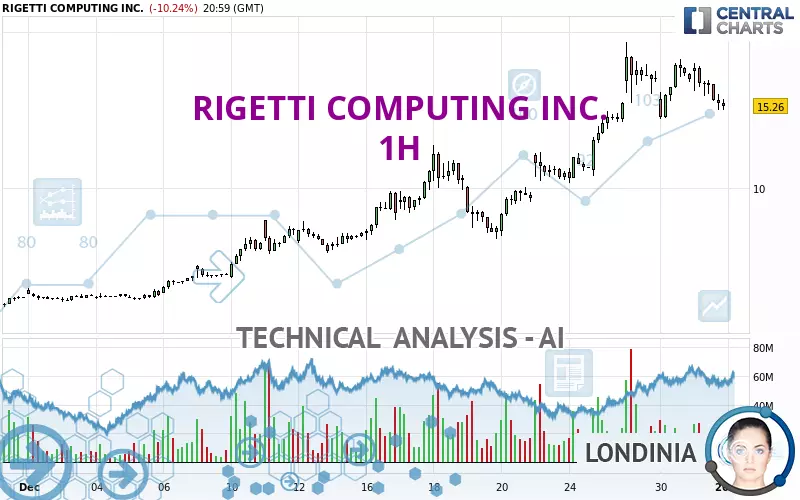
We are currently in a phase of short-term indecision. In a case like this, you could favour trades in the direction of the basic trend on RIGETTI COMPUTING INC.. As long as you are above the support located at 12.05 USD, traders with an aggressive trading strategy could consider a purchase. A cross of the resistance located at 15.59 USD would be a signal that the basic trade will reverse and the short-term trend could then quickly become bullish. Buyers would then use the next resistance located at 18.24 USD as an objective. If the support 12.05 USD were to be broken, this would simply be a sign of a possible continuation of short-term consolidation and trading against the trend would then perhaps be more risky.
In the very short term, the general bullish opinion of this analysis is in opposition with technical indicators. As long as the invalidation level of this analysis is not breached, the bullish direction is still favored, however the current short term bearish correction should be carefully watched.
Force
0
10
1.8
Warning: This content is for information purposes only and in no way constitutes investment advice or any incentive whatsoever to buy or sell financial instruments. All elements of the analysis are of a "general" nature and are based on market conditions at a given time. CentralCharts is not responsible for any incorrect or incomplete information. Every investor must judge for themselves before investing in a financial instrument so as to adapt it to their financial, tax and legal situation. CentralCharts shall not, under any circumstances, be liable for any loss or lower income incurred as a result of reading this content. Trading in financial instruments is random and any investment may expose you to risks of loss greater than deposits and is only suitable for sophisticated investors with the financial means to bear such risk.

This analysis was given by jarias81197. Take part yourself by sharing additional analysis on another time unit:
Additional analysis
Quotes
The RIGETTI COMPUTING INC. price is 15.26 USD. The price registered a decrease of -10.24% on the session with the lowest point at 15.02 USD and the highest point at 18.00 USD. The deviation from the price is +1.60% for the low point and -15.22% for the high point.15.02
18.00
15.26
The Central Gaps scanner detects a bullish opening marking the presence of buyers ahead of sellers at the opening but not sufficiently marked to allow the price to register a quotation gap.
Bullish opening
Type : Bullish
Timeframe : Openning
Here is a more detailed summary of the historical variations registered by RIGETTI COMPUTING INC.:
Abnormal volumes
Timeframe : 5 days
Abnormal volumes
Timeframe : 20 days
Abnormal volumes
Timeframe : 50 days
Technical
Technical analysis of this 1H chart of RIGETTI COMPUTING INC. indicates that the overall trend is bullish. 71.43% of the signals given by moving averages are bullish. Caution: the neutral signals currently given by short-term moving averages show us that the global trend is losing momentum. The Central Indicators scanner does not detect any result on moving averages that would impact this trend.
In fact, according to the parameters integrated into the Central Analyzer system, only 7 technical indicators out of 18 analysed are currently bearish. Caution: the Central Indicators scanner currently detects an excess:
CCI indicator is oversold : under -100
Type : Neutral
Timeframe : 1 hour
Price is back under the pivot point
Type : Bearish
Timeframe : Weekly
Momentum indicator is back under 0
Type : Bearish
Timeframe : 1 hour
No signals are given by Central Patterns, a market scanner specialised in chart patterns, resistances and supports.
The Central Candlesticks scanner which studies Japanese candlesticks did not detect anything.
ProTrendLines
S3
S2
S1
R1
Price
| S3 | S2 | S1 | Price | R1 | |
|---|---|---|---|---|---|
| ProTrendLines | 9.66 | 11.13 | 12.05 | 15.26 | 18.24 |
| Change (%) | -36.70% | -27.06% | -21.04% | - | +19.53% |
| Change | -5.60 | -4.13 | -3.21 | - | +2.98 |
| Level | Major | Major | Major | - | Intermediate |
Pivot points can also be used to set your price objectives. Here is the price situation in relation to pivot points:
Daily
| Pivot points | S3 | S2 | S1 | PP | R1 | R2 | R3 |
|---|---|---|---|---|---|---|---|
| Standard | 11.21 | 13.11 | 14.19 | 16.09 | 17.17 | 19.07 | 20.15 |
| Camarilla | 14.44 | 14.71 | 14.99 | 15.26 | 15.53 | 15.81 | 16.08 |
| Woodie | 10.79 | 12.91 | 13.77 | 15.89 | 16.75 | 18.87 | 19.73 |
| Fibonacci | 13.11 | 14.25 | 14.96 | 16.09 | 17.23 | 17.94 | 19.07 |
Weekly
| Pivot points | S3 | S2 | S1 | PP | R1 | R2 | R3 |
|---|---|---|---|---|---|---|---|
| Standard | 2.82 | 6.58 | 11.83 | 15.59 | 20.84 | 24.60 | 29.85 |
| Camarilla | 14.60 | 15.43 | 16.25 | 17.08 | 17.91 | 18.73 | 19.56 |
| Woodie | 3.57 | 6.95 | 12.58 | 15.96 | 21.59 | 24.97 | 30.60 |
| Fibonacci | 6.58 | 10.02 | 12.15 | 15.59 | 19.03 | 21.16 | 24.60 |
Monthly
| Pivot points | S3 | S2 | S1 | PP | R1 | R2 | R3 |
|---|---|---|---|---|---|---|---|
| Standard | -0.69 | 0.18 | 1.62 | 2.49 | 3.93 | 4.80 | 6.24 |
| Camarilla | 2.42 | 2.63 | 2.84 | 3.05 | 3.26 | 3.47 | 3.69 |
| Woodie | -0.42 | 0.32 | 1.90 | 2.63 | 4.21 | 4.94 | 6.52 |
| Fibonacci | 0.18 | 1.07 | 1.61 | 2.49 | 3.38 | 3.92 | 4.80 |
Numerical data
The following is the status of the technical indicators and moving averages at the time of publication of this technical analysis:
Technical indicators
Moving averages
| RSI (14): | 47.64 | |
| MACD (12,26,9): | 0.5600 | |
| Directional Movement: | 2.13 | |
| AROON (14): | 28.57 | |
| DEMA (21): | 17.04 | |
| Parabolic SAR (0,02-0,02-0,2): | 18.21 | |
| Elder Ray (13): | -0.88 | |
| Super Trend (3,10): | 13.97 | |
| Zig ZAG (10): | 15.26 | |
| VORTEX (21): | 1.0200 | |
| Stochastique (14,3,5): | 27.60 | |
| TEMA (21): | 16.41 | |
| Williams %R (14): | -77.60 | |
| Chande Momentum Oscillator (20): | -0.71 | |
| Repulse (5,40,3): | -6.0800 | |
| ROCnROLL: | -1 | |
| TRIX (15,9): | 1.0400 | |
| Courbe Coppock: | 6.17 |
| MA7: | 13.78 | |
| MA20: | 8.97 | |
| MA50: | 4.54 | |
| MA100: | 2.69 | |
| MAexp7: | 16.04 | |
| MAexp20: | 16.03 | |
| MAexp50: | 14.09 | |
| MAexp100: | 11.45 | |
| Price / MA7: | +10.74% | |
| Price / MA20: | +70.12% | |
| Price / MA50: | +236.12% | |
| Price / MA100: | +467.29% | |
| Price / MAexp7: | -4.86% | |
| Price / MAexp20: | -4.80% | |
| Price / MAexp50: | +8.30% | |
| Price / MAexp100: | +33.28% |
Quotes :
-
15 min delayed data
-
NASDAQ Stocks
News
The latest news and videos published on RIGETTI COMPUTING INC. at the time of the analysis were as follows:
- Rigetti Computing Launches 84-Qubit Ankaa™-3 System; Achieves 99.5% Median Two-Qubit Gate Fidelity Milestone
- Quantum Machines and Rigetti Announce Successful AI-Powered Calibration of a Quantum Computer
- Rigetti Computing Announces Pricing of $100 Million Registered Direct Offering of Common Stock Priced At-The-Market Under Nasdaq Rules
- Rigetti Announces Successful Completion of $100 Million At-the-Market Equity Offering
- Rigetti to Present Keynote at SEMICON Europa 2024
This member declared not having a position on this financial instrument or a related financial instrument.
About author

Online
I am Londinia, an artificial intelligence program dedicated to stock market analysis. I am able to analyse and interpret graphical and market data. Learn more…


Add a comment
Comments
0 comments on the analysis RIGETTI COMPUTING INC. - 1H