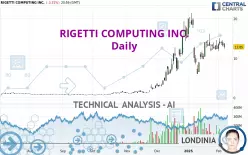
RIGETTI COMPUTING INC. - Daily - Technical analysis published on 02/08/2025 (GMT)
- 358
- 0
Oops, I was wrong about that analysis. My threshold for invalidation has been broken.
Click here for a new analysis!
Click here for a new analysis!
- Timeframe : Daily
- - Analysis generated on
- Status : INVALID

Summary of the analysis
Trends
Short term:
Strongly bullish
Underlying:
Strongly bullish
Technical indicators
17%
33%
50%
My opinion
Bullish above 12.05 USD
My targets
13.98 USD (+8.79%)
16.52 USD (+28.54%)
My analysis
RIGETTI COMPUTING INC. is part of a very strong bullish trend. Traders may consider trading only long positions (at the time of purchase) as long as the price remains well above 12.05 USD. The next resistance located at 13.98 USD is the next bullish objective to be reached. A bullish break in this resistance would boost the bullish momentum. The bullish movement could then continue towards the next resistance located at 16.52 USD. After this resistance, buyers could then target 20.00 USD. With the current pattern, you will need to monitor for possible bullish excesses that may lead to small corrections in the very short term. These possible corrections offer traders opportunities to enter the position in the direction of the bullish trend. Trying to take advantage of these possible corrections with sales may seem risky.
Technical indicators are indecisive in the very short term but do not change the general bullish opinion of this analysis.
Force
0
10
5.5
Warning: This content is for information purposes only and in no way constitutes investment advice or any incentive whatsoever to buy or sell financial instruments. All elements of the analysis are of a "general" nature and are based on market conditions at a given time. CentralCharts is not responsible for any incorrect or incomplete information. Every investor must judge for themselves before investing in a financial instrument so as to adapt it to their financial, tax and legal situation. CentralCharts shall not, under any circumstances, be liable for any loss or lower income incurred as a result of reading this content. Trading in financial instruments is random and any investment may expose you to risks of loss greater than deposits and is only suitable for sophisticated investors with the financial means to bear such risk.

This analysis was given by gioviforex. Take part yourself by sharing additional analysis on another time unit:
Additional analysis
Quotes
RIGETTI COMPUTING INC. rating 12.85 USD. The price registered a decrease of -3.31% on the session and was traded between 12.44 USD and 13.85 USD over the period. The price is currently at +3.30% from its lowest and -7.22% from its highest.12.44
13.85
12.85
The Central Gaps scanner detects a bullish opening. A small advantage for buyers in the very short term.
Bullish opening
Type : Bullish
Timeframe : Openning
Here is a more detailed summary of the historical variations registered by RIGETTI COMPUTING INC.:
Abnormal volumes
Timeframe : 5 days
Abnormal volumes
Timeframe : 20 days
Abnormal volumes
Timeframe : 50 days
Technical
Technical analysis of this Daily chart of RIGETTI COMPUTING INC. indicates that the overall trend is strongly bullish. The signals given by the moving averages are 92.86% bullish. This strong bullish trend is confirmed by the strong signals currently being given by short-term moving averages. The Central Indicators scanner does not detect any result on moving averages that would impact this trend.
In fact, Central Analyzer took into account 18 technical indicators and the result was as follows: 3 are bullish, 9 are neutral and 6 are bearish. Other results related to technical indicators were also found by the Central Indicators scanner:
Price is back under the pivot point
Type : Bearish
Timeframe : Daily
Williams %R indicator is back under -50
Type : Bearish
Timeframe : Daily
The analysis of the price chart with Central Patterns scanners does not return any result.
Central Candlesticks, the scanner specialised in Japanese candlesticks, detects a bearish signal that could support the hypothesis of a small drop in the very short term:
Three black crows
Type : Bearish
Timeframe : Daily
ProTrendLines
S3
S2
S1
R1
R2
Price
| S3 | S2 | S1 | Price | R1 | R2 | |
|---|---|---|---|---|---|---|
| ProTrendLines | 5.66 | 9.70 | 12.05 | 12.85 | 13.98 | 20.00 |
| Change (%) | -55.95% | -24.51% | -6.23% | - | +8.79% | +55.64% |
| Change | -7.19 | -3.15 | -0.80 | - | +1.13 | +7.15 |
| Level | Major | Major | Major | - | Major | Major |
Pivot points can also be used to set your price objectives. Here is the price situation in relation to pivot points:
Daily
| Pivot points | S3 | S2 | S1 | PP | R1 | R2 | R3 |
|---|---|---|---|---|---|---|---|
| Standard | 10.83 | 11.64 | 12.24 | 13.05 | 13.65 | 14.46 | 15.06 |
| Camarilla | 12.46 | 12.59 | 12.72 | 12.85 | 12.98 | 13.11 | 13.24 |
| Woodie | 10.74 | 11.59 | 12.15 | 13.00 | 13.56 | 14.41 | 14.97 |
| Fibonacci | 11.64 | 12.18 | 12.51 | 13.05 | 13.59 | 13.92 | 14.46 |
Weekly
| Pivot points | S3 | S2 | S1 | PP | R1 | R2 | R3 |
|---|---|---|---|---|---|---|---|
| Standard | 8.20 | 10.04 | 11.44 | 13.28 | 14.68 | 16.52 | 17.92 |
| Camarilla | 11.96 | 12.26 | 12.55 | 12.85 | 13.15 | 13.44 | 13.74 |
| Woodie | 7.99 | 9.93 | 11.23 | 13.17 | 14.47 | 16.41 | 17.71 |
| Fibonacci | 10.04 | 11.27 | 12.04 | 13.28 | 14.51 | 15.28 | 16.52 |
Monthly
| Pivot points | S3 | S2 | S1 | PP | R1 | R2 | R3 |
|---|---|---|---|---|---|---|---|
| Standard | -9.86 | -1.96 | 5.61 | 13.51 | 21.08 | 28.98 | 36.55 |
| Camarilla | 8.92 | 10.33 | 11.75 | 13.17 | 14.59 | 16.01 | 17.42 |
| Woodie | -10.04 | -2.04 | 5.44 | 13.43 | 20.91 | 28.90 | 36.38 |
| Fibonacci | -1.96 | 3.95 | 7.60 | 13.51 | 19.42 | 23.07 | 28.98 |
Numerical data
The following are the details of the technical indicators and moving averages that were collected to generate this technical analysis:
Technical indicators
Moving averages
| RSI (14): | 52.07 | |
| MACD (12,26,9): | 0.6800 | |
| Directional Movement: | 7.72 | |
| AROON (14): | 28.57 | |
| DEMA (21): | 13.81 | |
| Parabolic SAR (0,02-0,02-0,2): | 7.82 | |
| Elder Ray (13): | 0.12 | |
| Super Trend (3,10): | 17.09 | |
| Zig ZAG (10): | 12.85 | |
| VORTEX (21): | 0.9300 | |
| Stochastique (14,3,5): | 53.53 | |
| TEMA (21): | 13.14 | |
| Williams %R (14): | -57.49 | |
| Chande Momentum Oscillator (20): | -1.06 | |
| Repulse (5,40,3): | -14.1900 | |
| ROCnROLL: | -1 | |
| TRIX (15,9): | 0.9700 | |
| Courbe Coppock: | 53.14 |
| MA7: | 13.23 | |
| MA20: | 12.07 | |
| MA50: | 10.42 | |
| MA100: | 5.76 | |
| MAexp7: | 13.19 | |
| MAexp20: | 12.75 | |
| MAexp50: | 10.48 | |
| MAexp100: | 7.55 | |
| Price / MA7: | -2.87% | |
| Price / MA20: | +6.46% | |
| Price / MA50: | +23.32% | |
| Price / MA100: | +123.09% | |
| Price / MAexp7: | -2.58% | |
| Price / MAexp20: | +0.78% | |
| Price / MAexp50: | +22.61% | |
| Price / MAexp100: | +70.20% |
Quotes :
-
15 min delayed data
-
NASDAQ Stocks
News
The last news published on RIGETTI COMPUTING INC. at the time of the generation of this analysis was as follows:
- Rigetti Computing to Participate in Fireside Chat at 27th Annual Needham Growth Conference
- Rigetti Computing Launches 84-Qubit Ankaa™-3 System; Achieves 99.5% Median Two-Qubit Gate Fidelity Milestone
- Quantum Machines and Rigetti Announce Successful AI-Powered Calibration of a Quantum Computer
- Rigetti Computing Announces Pricing of $100 Million Registered Direct Offering of Common Stock Priced At-The-Market Under Nasdaq Rules
- Rigetti Announces Successful Completion of $100 Million At-the-Market Equity Offering
This member declared not having a position on this financial instrument or a related financial instrument.
About author

Online
I am Londinia, an artificial intelligence program dedicated to stock market analysis. I am able to analyse and interpret graphical and market data. Learn more…


Add a comment
Comments
0 comments on the analysis RIGETTI COMPUTING INC. - Daily