JOHNSON & JOHNSON - Daily - Technical analysis published on 07/17/2024 (GMT)
- 107
- 0
Click here for a new analysis!
- Timeframe : Daily
- - Analysis generated on
- Status : TARGET REACHED

Summary of the analysis

Additional analysis
Quotes
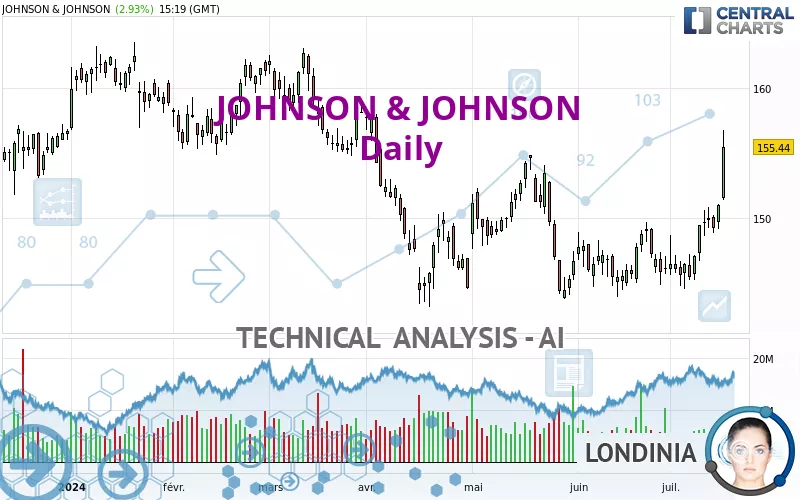
JOHNSON & JOHNSON rating 155.44 USD. The price has increased by +2.93% since the last closing with the lowest point at 151.41 USD and the highest point at 156.79 USD. The deviation from the price is +2.66% for the low point and -0.86% for the high point.The Central Gaps scanner detects a bullish gap which is a sign that buyers have taken the lead in the very short term.
Opening Gap UP
Type : Bullish
Timeframe : Openning
A study of price movements over other periods shows the following variations:
Near a new HIGH record (1st january)
Type : Bullish
Timeframe : Weekly
New HIGH record (1 month)
Type : Bullish
Timeframe : Weekly
Technical
Technical analysis of JOHNSON & JOHNSON in Daily shows an overall bullish trend. The signals returned by the moving averages are 64.29% bullish. This bullish trend is reinforced by the strong signals currently being given by short-term moving averages. The Central Indicators market scanner is currently detecting a bullish signal that could impact this trend:
Bullish price crossover with adaptative moving average 100
Type : Bullish
Timeframe : Daily
Technical indicators are strongly bullish, suggesting that the price increase should continue.
Caution: the Central Indicators scanner currently detects an excess:
RSI indicator is overbought : over 70
Type : Neutral
Timeframe : Daily
CCI indicator is overbought : over 100
Type : Neutral
Timeframe : Daily
Williams %R indicator is overbought : over -20
Type : Neutral
Timeframe : Daily
Pivot points : price is over resistance 2
Type : Neutral
Timeframe : Weekly
Pivot points : price is over resistance 3
Type : Neutral
Timeframe : Daily
SuperTrend indicator bullish reversal
Type : Bullish
Timeframe : Daily
An analysis of the price chart with the Central Patterns scanner (detector of chart patterns and resistances and supports) shows several results that can have an impact on the price change:
Horizontal resistance is broken
Type : Bullish
Timeframe : Daily
Resistance of channel is broken
Type : Bullish
Timeframe : Daily
For a small rebound in the very short term, the Central Candlesticks scanner currently notes the presence of this bullish pattern in Japanese candlesticks:
Upside gap
Type : Bullish
Timeframe : Daily
| S3 | S2 | S1 | Price | R1 | R2 | R3 | |
|---|---|---|---|---|---|---|---|
| ProTrendLines | 149.12 | 150.89 | 153.39 | 155.44 | 156.42 | 161.24 | 169.17 |
| Change (%) | -4.07% | -2.93% | -1.32% | - | +0.63% | +3.73% | +8.83% |
| Change | -6.32 | -4.55 | -2.05 | - | +0.98 | +5.80 | +13.73 |
| Level | Major | Intermediate | Major | - | Minor | Intermediate | Minor |
To determine price objectives, it is also possible to use the pivot points. Here is the price position in relation to pivot points:
| Pivot points | S3 | S2 | S1 | PP | R1 | R2 | R3 |
|---|---|---|---|---|---|---|---|
| Standard | 147.83 | 148.50 | 149.75 | 150.42 | 151.67 | 152.34 | 153.59 |
| Camarilla | 150.48 | 150.66 | 150.83 | 151.01 | 151.19 | 151.36 | 151.54 |
| Woodie | 148.13 | 148.65 | 150.05 | 150.57 | 151.97 | 152.49 | 153.89 |
| Fibonacci | 148.50 | 149.23 | 149.68 | 150.42 | 151.15 | 151.60 | 152.34 |
| Pivot points | S3 | S2 | S1 | PP | R1 | R2 | R3 |
|---|---|---|---|---|---|---|---|
| Standard | 140.71 | 142.95 | 146.41 | 148.65 | 152.11 | 154.35 | 157.81 |
| Camarilla | 148.31 | 148.84 | 149.36 | 149.88 | 150.40 | 150.93 | 151.45 |
| Woodie | 141.33 | 143.26 | 147.03 | 148.96 | 152.73 | 154.66 | 158.43 |
| Fibonacci | 142.95 | 145.12 | 146.47 | 148.65 | 150.82 | 152.17 | 154.35 |
| Pivot points | S3 | S2 | S1 | PP | R1 | R2 | R3 |
|---|---|---|---|---|---|---|---|
| Standard | 137.61 | 140.75 | 143.45 | 146.59 | 149.29 | 152.43 | 155.13 |
| Camarilla | 144.55 | 145.09 | 145.63 | 146.16 | 146.70 | 147.23 | 147.77 |
| Woodie | 137.40 | 140.64 | 143.24 | 146.48 | 149.08 | 152.32 | 154.92 |
| Fibonacci | 140.75 | 142.98 | 144.36 | 146.59 | 148.82 | 150.20 | 152.43 |
Numerical data
The following are the details of the technical indicators and moving averages that were collected to generate this technical analysis:
| RSI (14): | 74.44 | |
| MACD (12,26,9): | 1.1900 | |
| Directional Movement: | 27.50 | |
| AROON (14): | 57.14 | |
| DEMA (21): | 149.88 | |
| Parabolic SAR (0,02-0,02-0,2): | 145.98 | |
| Elder Ray (13): | 4.66 | |
| Super Trend (3,10): | 147.10 | |
| Zig ZAG (10): | 156.01 | |
| VORTEX (21): | 1.1500 | |
| Stochastique (14,3,5): | 88.15 | |
| TEMA (21): | 151.18 | |
| Williams %R (14): | -10.05 | |
| Chande Momentum Oscillator (20): | 9.37 | |
| Repulse (5,40,3): | 3.9200 | |
| ROCnROLL: | 1 | |
| TRIX (15,9): | 0.0300 | |
| Courbe Coppock: | 4.43 |
| MA7: | 150.26 | |
| MA20: | 147.99 | |
| MA50: | 148.05 | |
| MA100: | 150.53 | |
| MAexp7: | 150.75 | |
| MAexp20: | 148.72 | |
| MAexp50: | 148.47 | |
| MAexp100: | 149.90 | |
| Price / MA7: | +3.45% | |
| Price / MA20: | +5.03% | |
| Price / MA50: | +4.99% | |
| Price / MA100: | +3.26% | |
| Price / MAexp7: | +3.11% | |
| Price / MAexp20: | +4.52% | |
| Price / MAexp50: | +4.69% | |
| Price / MAexp100: | +3.70% |
News
The latest news and videos published on JOHNSON & JOHNSON at the time of the analysis were as follows:
- Johnson & Johnson Announces Preliminary Results of Kenvue Inc. Exchange Offer
- Thinking about trading options or stock in Meta Platforms, Rigetti Computing, Sea Ltd, Paysafe, or Johnson & Johnson?
- Johnson & Johnson Announces Final Exchange Ratio of 8.0324 in Split-Off of Kenvue Inc.
- Johnson & Johnson to Participate in the 2023 Wells Fargo Securities Healthcare Conference
- Kenvue To File Form S-4 Registration Statement in Connection with Johnson & Johnson Exchange Offer Announcement
About author
Online


Add a comment
Comments
0 comments on the analysis JOHNSON & JOHNSON - Daily