JOHNSON & JOHNSON - 1H - Technical analysis published on 07/17/2024 (GMT)
- 188
- 0
Click here for a new analysis!
- Timeframe : 1H
- - Analysis generated on
- Status : TARGET REACHED
Summary of the analysis

Additional analysis
Quotes
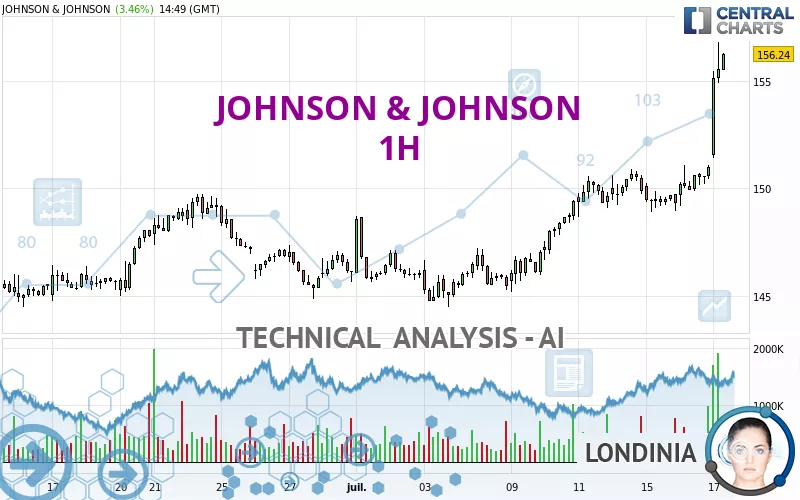
The JOHNSON & JOHNSON price is 155.34 USD. On the day, this instrument gained +2.87% and was between 151.41 USD and 156.79 USD. This implies that the price is at +2.60% from its lowest and at -0.92% from its highest.The Central Gaps scanner detects the formation of a bullish gap marking the strong presence of buyers against sellers at the opening. This formed a quotation gap.
Opening Gap UP
Type : Bullish
Timeframe : Openning
Here is a more detailed summary of the historical variations registered by JOHNSON & JOHNSON:
Near a new HIGH record (1st january)
Type : Bullish
Timeframe : Weekly
New HIGH record (1 month)
Type : Bullish
Timeframe : Weekly
Technical
Technical analysis of JOHNSON & JOHNSON in 1H shows a strongly overall bullish trend. 92.86% of the signals given by moving averages are bullish. The overall trend is supported by the strong bullish signals from short-term moving averages. The Central Indicators scanner does not detect any result on moving averages that would impact this trend.
An assessment of technical indicators shows a strong bullish signal.
Caution: the Central Indicators scanner currently detects an excess:
RSI indicator is overbought : over 80
Type : Neutral
Timeframe : 1 hour
CCI indicator is overbought : over 100
Type : Neutral
Timeframe : 1 hour
Previous candle closed over Bollinger bands
Type : Neutral
Timeframe : 1 hour
Williams %R indicator is overbought : over -20
Type : Neutral
Timeframe : 1 hour
Pivot points : price is over resistance 2
Type : Neutral
Timeframe : Weekly
Pivot points : price is over resistance 3
Type : Neutral
Timeframe : 1 hour
An analysis of the price chart with the Central Patterns scanner (detector of chart patterns and resistances and supports) shows a result that can have an impact on the price change:
Resistance of channel is broken
Type : Bullish
Timeframe : 1 hour
The Central Candlesticks scanner which studies Japanese candlesticks did not detect anything.
| S3 | S2 | S1 | Price | R1 | R2 | R3 | |
|---|---|---|---|---|---|---|---|
| ProTrendLines | 149.12 | 150.89 | 153.39 | 155.34 | 156.42 | 161.24 | 169.17 |
| Change (%) | -4.00% | -2.86% | -1.26% | - | +0.70% | +3.80% | +8.90% |
| Change | -6.22 | -4.45 | -1.95 | - | +1.08 | +5.90 | +13.83 |
| Level | Major | Intermediate | Major | - | Minor | Intermediate | Minor |
Pivot points can also be used to set your price objectives. Here is the price situation in relation to pivot points:
| Pivot points | S3 | S2 | S1 | PP | R1 | R2 | R3 |
|---|---|---|---|---|---|---|---|
| Standard | 147.83 | 148.50 | 149.75 | 150.42 | 151.67 | 152.34 | 153.59 |
| Camarilla | 150.48 | 150.66 | 150.83 | 151.01 | 151.19 | 151.36 | 151.54 |
| Woodie | 148.13 | 148.65 | 150.05 | 150.57 | 151.97 | 152.49 | 153.89 |
| Fibonacci | 148.50 | 149.23 | 149.68 | 150.42 | 151.15 | 151.60 | 152.34 |
| Pivot points | S3 | S2 | S1 | PP | R1 | R2 | R3 |
|---|---|---|---|---|---|---|---|
| Standard | 140.71 | 142.95 | 146.41 | 148.65 | 152.11 | 154.35 | 157.81 |
| Camarilla | 148.31 | 148.84 | 149.36 | 149.88 | 150.40 | 150.93 | 151.45 |
| Woodie | 141.33 | 143.26 | 147.03 | 148.96 | 152.73 | 154.66 | 158.43 |
| Fibonacci | 142.95 | 145.12 | 146.47 | 148.65 | 150.82 | 152.17 | 154.35 |
| Pivot points | S3 | S2 | S1 | PP | R1 | R2 | R3 |
|---|---|---|---|---|---|---|---|
| Standard | 137.61 | 140.75 | 143.45 | 146.59 | 149.29 | 152.43 | 155.13 |
| Camarilla | 144.55 | 145.09 | 145.63 | 146.16 | 146.70 | 147.23 | 147.77 |
| Woodie | 137.40 | 140.64 | 143.24 | 146.48 | 149.08 | 152.32 | 154.92 |
| Fibonacci | 140.75 | 142.98 | 144.36 | 146.59 | 148.82 | 150.20 | 152.43 |
Numerical data
The following is the status of technical indicators and moving averages registered at the time this technical analysis was created:
| RSI (14): | 85.12 | |
| MACD (12,26,9): | 1.1900 | |
| Directional Movement: | 48.94 | |
| AROON (14): | 100.00 | |
| DEMA (21): | 152.36 | |
| Parabolic SAR (0,02-0,02-0,2): | 149.38 | |
| Elder Ray (13): | 4.21 | |
| Super Trend (3,10): | 152.48 | |
| Zig ZAG (10): | 156.01 | |
| VORTEX (21): | 1.2900 | |
| Stochastique (14,3,5): | 93.99 | |
| TEMA (21): | 152.94 | |
| Williams %R (14): | -9.07 | |
| Chande Momentum Oscillator (20): | 6.69 | |
| Repulse (5,40,3): | 2.8400 | |
| ROCnROLL: | 1 | |
| TRIX (15,9): | 0.0600 | |
| Courbe Coppock: | 3.28 |
| MA7: | 150.35 | |
| MA20: | 147.98 | |
| MA50: | 148.04 | |
| MA100: | 150.53 | |
| MAexp7: | 152.74 | |
| MAexp20: | 150.97 | |
| MAexp50: | 149.46 | |
| MAexp100: | 148.39 | |
| Price / MA7: | +3.32% | |
| Price / MA20: | +4.97% | |
| Price / MA50: | +4.93% | |
| Price / MA100: | +3.20% | |
| Price / MAexp7: | +1.70% | |
| Price / MAexp20: | +2.89% | |
| Price / MAexp50: | +3.93% | |
| Price / MAexp100: | +4.68% |
News
Don't forget to follow the news on JOHNSON & JOHNSON. At the time of publication of this analysis, the latest news was as follows:
- Johnson & Johnson Announces Preliminary Results of Kenvue Inc. Exchange Offer
- Thinking about trading options or stock in Meta Platforms, Rigetti Computing, Sea Ltd, Paysafe, or Johnson & Johnson?
- Johnson & Johnson Announces Final Exchange Ratio of 8.0324 in Split-Off of Kenvue Inc.
- Johnson & Johnson to Participate in the 2023 Wells Fargo Securities Healthcare Conference
- Kenvue To File Form S-4 Registration Statement in Connection with Johnson & Johnson Exchange Offer Announcement
About author
Online


Add a comment
Comments
0 comments on the analysis JOHNSON & JOHNSON - 1H