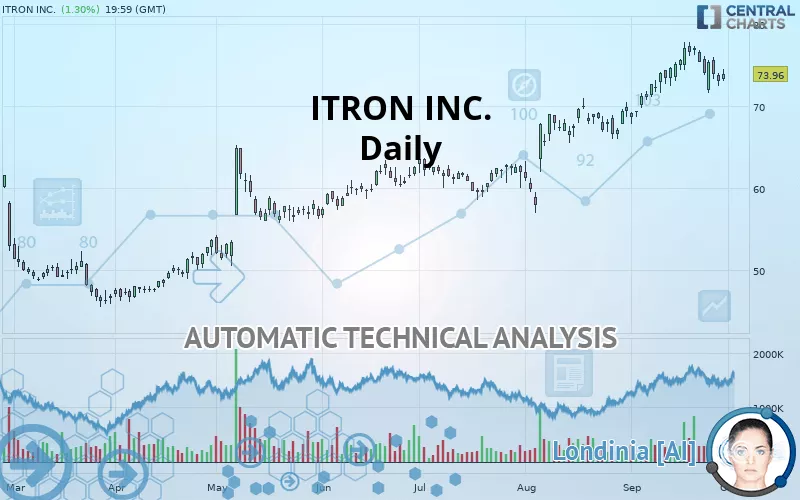
ITRON INC. - Daily - Technical analysis published on 10/01/2019 (GMT)
- 283
- 0
- Who voted?
Click here for a new analysis!
- Timeframe : Daily
- - Analysis generated on
- Status : LEVEL MAINTAINED
Summary of the analysis

Additional analysis
Quotes
ITRON INC. rating 73.96 USD. The price registered an increase of +1.30% on the session and was traded between 73.07 USD and 74.49 USD over the period. The price is currently at +1.22% from its lowest and -0.71% from its highest.A bullish opening was detected by the Central Gaps scanner. Buyers are trying to impose a bullish momentum in the very short term.
Bullish opening
Type : Bullish
Timeframe : Openning
Here is a more detailed summary of the historical variations registered by ITRON INC.:
Near a new HIGH record (1 year)
Type : Bullish
Timeframe : Weekly
Near a new HIGH record (1st january)
Type : Bullish
Timeframe : Weekly
Near a new HIGH record (1 month)
Type : Bullish
Timeframe : Weekly
Technical
Technical analysis of ITRON INC. in Daily shows a strongly overall bullish trend. 92.86% of the signals given by moving averages are bullish. This strongly bullish trend is supported by the strong bullish signals given by short-term moving averages. The Central Indicators market scanner is currently detecting a bearish signal that could impact this trend:
Bearish price crossover with Moving Average 20
Type : Bearish
Timeframe : Daily
In fact, of the 18 technical indicators analysed by Central Analyzer, 6 are bullish, 6 are neutral and 6 are bearish. Central Indicators, the scanner specialised in technical indicators, has identified these signals:
Pivot points : price is over resistance 1
Type : Neutral
Timeframe : Daily
Price is back under the pivot point
Type : Bearish
Timeframe : Daily
Price is back under the pivot point
Type : Bearish
Timeframe : Weekly
Momentum indicator is back under 0
Type : Bearish
Timeframe : Daily
Central Patterns, the market scanner focusing on chart patterns, resistances and supports found this result:
Support of channel is broken
Type : Bearish
Timeframe : Daily
No result was found by the Central Candlesticks scanner on Japanese candlesticks.
| S3 | S2 | S1 | Price | R1 | R2 | |
|---|---|---|---|---|---|---|
| ProTrendLines | 57.96 | 61.72 | 65.91 | 73.96 | 79.40 | 109.21 |
| Change (%) | -21.63% | -16.55% | -10.88% | - | +7.36% | +47.66% |
| Change | -16.00 | -12.24 | -8.05 | - | +5.44 | +35.25 |
| Level | Intermediate | Intermediate | Major | - | Major | Intermediate |
Pivot points can also be used to set your price objectives. Here is the price situation in relation to pivot points:
| Pivot points | S3 | S2 | S1 | PP | R1 | R2 | R3 |
|---|---|---|---|---|---|---|---|
| Standard | 70.67 | 71.56 | 72.29 | 73.18 | 73.91 | 74.80 | 75.53 |
| Camarilla | 72.57 | 72.71 | 72.86 | 73.01 | 73.16 | 73.31 | 73.46 |
| Woodie | 70.58 | 71.52 | 72.20 | 73.14 | 73.82 | 74.76 | 75.44 |
| Fibonacci | 71.56 | 72.18 | 72.56 | 73.18 | 73.80 | 74.18 | 74.80 |
| Pivot points | S3 | S2 | S1 | PP | R1 | R2 | R3 |
|---|---|---|---|---|---|---|---|
| Standard | 65.56 | 68.56 | 70.78 | 73.78 | 76.01 | 79.01 | 81.23 |
| Camarilla | 71.57 | 72.05 | 72.53 | 73.01 | 73.49 | 73.97 | 74.45 |
| Woodie | 65.17 | 68.37 | 70.40 | 73.59 | 75.62 | 78.81 | 80.85 |
| Fibonacci | 68.56 | 70.55 | 71.79 | 73.78 | 75.78 | 77.01 | 79.01 |
| Pivot points | S3 | S2 | S1 | PP | R1 | R2 | R3 |
|---|---|---|---|---|---|---|---|
| Standard | 46.53 | 51.74 | 60.59 | 65.80 | 74.65 | 79.86 | 88.71 |
| Camarilla | 65.58 | 66.87 | 68.16 | 69.45 | 70.74 | 72.03 | 73.32 |
| Woodie | 48.36 | 52.65 | 62.42 | 66.71 | 76.48 | 80.77 | 90.54 |
| Fibonacci | 51.74 | 57.11 | 60.43 | 65.80 | 71.17 | 74.49 | 79.86 |
Numerical data
The following is the status of technical indicators and moving averages registered at the time this technical analysis was created:
| RSI (14): | 55.57 | |
| MACD (12,26,9): | 1.6300 | |
| Directional Movement: | 1.22 | |
| AROON (14): | 35.72 | |
| DEMA (21): | 75.77 | |
| Parabolic SAR (0,02-0,02-0,2): | 77.01 | |
| Elder Ray (13): | -0.34 | |
| Super Trend (3,10): | 71.10 | |
| Zig ZAG (10): | 73.96 | |
| VORTEX (21): | 1.1100 | |
| Stochastique (14,3,5): | 34.44 | |
| TEMA (21): | 75.46 | |
| Williams %R (14): | -61.34 | |
| Chande Momentum Oscillator (20): | 0.59 | |
| Repulse (5,40,3): | -0.0900 | |
| ROCnROLL: | -1 | |
| TRIX (15,9): | 0.4400 | |
| Courbe Coppock: | 8.28 |
| MA7: | 74.65 | |
| MA20: | 73.72 | |
| MA50: | 68.88 | |
| MA100: | 64.31 | |
| MAexp7: | 74.30 | |
| MAexp20: | 73.35 | |
| MAexp50: | 69.68 | |
| MAexp100: | 65.45 | |
| Price / MA7: | -0.92% | |
| Price / MA20: | +0.33% | |
| Price / MA50: | +7.38% | |
| Price / MA100: | +15.01% | |
| Price / MAexp7: | -0.46% | |
| Price / MAexp20: | +0.83% | |
| Price / MAexp50: | +6.14% | |
| Price / MAexp100: | +13.00% |
News
The last news published on ITRON INC. at the time of the generation of this analysis was as follows:
- Itron Signs Global Reseller Agreement with TerraGo to Accelerate Smart Streetlight Projects
- Xcel Energy and Itron Collaborate to Transform Customer Experience and Utility Operations
- Xcel Energy and Itron Collaborate to Bring Advanced Technology to Energy Industry
- Itron Collaborates with sonnen to Add Battery Storage to its Distributed Energy Management and Demand Response Solutions
- Utilidata and Itron Join Forces to Modernize Electric Grid
About author

Online


Add a comment
Comments
0 comments on the analysis ITRON INC. - Daily