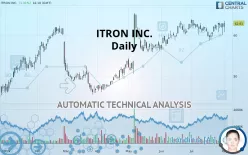
ITRON INC. - Daily - Technical analysis published on 08/01/2019 (GMT)
- 317
- 0
- Who voted?
Oops, I was wrong about that analysis. My threshold for invalidation has been broken.
Click here for a new analysis!
Click here for a new analysis!
- Timeframe : Daily
- - Analysis generated on
- Status : INVALID

Summary of the analysis
Trends
Court terme:
Strongly bullish
De fond:
Strongly bullish
Technical indicators
67%
6%
28%
My opinion
Bullish above 61.72 USD
My targets
64.06 USD (+1.99%)
71.35 USD (+13.60%)
My analysis
ITRON INC. is part of a very strong bullish trend. Traders may consider trading only long positions (at the time of purchase) as long as the price remains well above 61.72 USD. The next resistance located at 64.06 USD is the next bullish objective to be reached. A bullish break in this resistance would boost the bullish momentum. The bullish movement could then continue towards the next resistance located at 71.35 USD. After this resistance, buyers could then target 79.40 USD. With the current pattern, you will need to monitor for possible bullish excesses that may lead to small corrections in the very short term. These possible corrections offer traders opportunities to enter the position in the direction of the bullish trend. Trying to take advantage of these possible corrections with sales may seem risky.
Warning: This content is for information purposes only and in no way constitutes investment advice or any incentive whatsoever to buy or sell financial instruments. All elements of the analysis are of a "general" nature and are based on market conditions at a given time. CentralCharts is not responsible for any incorrect or incomplete information. Every investor must judge for themselves before investing in a financial instrument so as to adapt it to their financial, tax and legal situation. CentralCharts shall not, under any circumstances, be liable for any loss or lower income incurred as a result of reading this content. Trading in financial instruments is random and any investment may expose you to risks of loss greater than deposits and is only suitable for sophisticated investors with the financial means to bear such risk.

This analysis was given by Vincent Launay. Take part yourself by sharing additional analysis on another time unit:
Additional analysis
Quotes
ITRON INC. rating 62.81 USD. The price registered an increase of +1.31% on the session and was between 60.83 USD and 63.35 USD. This implies that the price is at +3.25% from its lowest and at -0.85% from its highest.60.83
63.35
62.81
Here is a more detailed summary of the historical variations registered by ITRON INC.:
Near a new HIGH record (1st january)
Type : Bullish
Timeframe : Weekly
Technical
Technical analysis of this Daily chart of ITRON INC. indicates that the overall trend is strongly bullish. 92.86% of the signals given by moving averages are bullish. This strongly bullish trend is supported by the strong bullish signals given by short-term moving averages. The Central Indicators scanner does not detect any result on moving averages that would impact this trend.
An assessment of technical indicators shows a moderate bullish signal.
Caution: the Central Indicators scanner currently detects an excess:
Williams %R indicator is overbought : over -20
Type : Neutral
Timeframe : Daily
Price is back over the pivot point
Type : Bullish
Timeframe : Weekly
An analysis of the price chart with the Central Patterns scanner (detector of chart patterns and resistances and supports) shows several results that can have an impact on the price change:
Near resistance of channel
Type : Bearish
Timeframe : Daily
Resistance of triangle is broken
Type : Bullish
Timeframe : Daily
The Central Candlesticks scanner, specialised in Japanese candlesticks, did not identify any signals.
ProTrendLines
S3
S2
S1
R1
R2
R3
Price
| S3 | S2 | S1 | Price | R1 | R2 | R3 | |
|---|---|---|---|---|---|---|---|
| ProTrendLines | 55.77 | 58.85 | 61.72 | 62.81 | 64.06 | 71.35 | 79.40 |
| Change (%) | -11.21% | -6.30% | -1.74% | - | +1.99% | +13.60% | +26.41% |
| Change | -7.04 | -3.96 | -1.09 | - | +1.25 | +8.54 | +16.59 |
| Level | Intermediate | Major | Major | - | Major | Minor | Major |
Pivot points can also be used to set your price objectives. Here is the price situation in relation to pivot points:
Daily
| Pivot points | S3 | S2 | S1 | PP | R1 | R2 | R3 |
|---|---|---|---|---|---|---|---|
| Standard | 57.51 | 58.75 | 60.37 | 61.61 | 63.24 | 64.48 | 66.10 |
| Camarilla | 61.21 | 61.48 | 61.74 | 62.00 | 62.26 | 62.53 | 62.79 |
| Woodie | 57.70 | 58.84 | 60.57 | 61.71 | 63.43 | 64.57 | 66.30 |
| Fibonacci | 58.75 | 59.84 | 60.52 | 61.61 | 62.71 | 63.38 | 64.48 |
Weekly
| Pivot points | S3 | S2 | S1 | PP | R1 | R2 | R3 |
|---|---|---|---|---|---|---|---|
| Standard | 57.38 | 58.49 | 60.68 | 61.79 | 63.98 | 65.09 | 67.28 |
| Camarilla | 61.96 | 62.27 | 62.57 | 62.87 | 63.17 | 63.48 | 63.78 |
| Woodie | 57.92 | 58.76 | 61.22 | 62.06 | 64.52 | 65.36 | 67.82 |
| Fibonacci | 58.49 | 59.75 | 60.53 | 61.79 | 63.05 | 63.83 | 65.09 |
Monthly
| Pivot points | S3 | S2 | S1 | PP | R1 | R2 | R3 |
|---|---|---|---|---|---|---|---|
| Standard | 53.89 | 56.24 | 59.12 | 61.47 | 64.35 | 66.70 | 69.58 |
| Camarilla | 60.56 | 61.04 | 61.52 | 62.00 | 62.48 | 62.96 | 63.44 |
| Woodie | 54.16 | 56.38 | 59.39 | 61.61 | 64.62 | 66.84 | 69.85 |
| Fibonacci | 56.24 | 58.24 | 59.48 | 61.47 | 63.47 | 64.71 | 66.70 |
Numerical data
The following is the status of technical indicators and moving averages registered at the time this technical analysis was created:
Technical indicators
Moving averages
| RSI (14): | 60.73 | |
| MACD (12,26,9): | 0.5700 | |
| Directional Movement: | -5.79 | |
| AROON (14): | 71.43 | |
| DEMA (21): | 62.51 | |
| Parabolic SAR (0,02-0,02-0,2): | 58.60 | |
| Elder Ray (13): | 0.07 | |
| Super Trend (3,10): | 58.29 | |
| Zig ZAG (10): | 63.19 | |
| VORTEX (21): | 0.9700 | |
| Stochastique (14,3,5): | 87.91 | |
| TEMA (21): | 62.30 | |
| Williams %R (14): | -5.26 | |
| Chande Momentum Oscillator (20): | 2.22 | |
| Repulse (5,40,3): | 5.1200 | |
| ROCnROLL: | 1 | |
| TRIX (15,9): | 0.1000 | |
| Courbe Coppock: | 2.64 |
| MA7: | 62.48 | |
| MA20: | 61.64 | |
| MA50: | 60.53 | |
| MA100: | 56.04 | |
| MAexp7: | 62.29 | |
| MAexp20: | 61.76 | |
| MAexp50: | 60.23 | |
| MAexp100: | 58.15 | |
| Price / MA7: | +0.53% | |
| Price / MA20: | +1.90% | |
| Price / MA50: | +3.77% | |
| Price / MA100: | +12.08% | |
| Price / MAexp7: | +0.83% | |
| Price / MAexp20: | +1.70% | |
| Price / MAexp50: | +4.28% | |
| Price / MAexp100: | +8.01% |
News
The last news published on ITRON INC. at the time of the generation of this analysis was as follows:
- Itron Collaborates with sonnen to Add Battery Storage to its Distributed Energy Management and Demand Response Solutions
- Utilidata and Itron Join Forces to Modernize Electric Grid
- ITRON INVESTOR ALERT BY THE FORMER ATTORNEY GENERAL OF LOUISIANA: Kahn Swick & Foti, LLC Investigates Adequacy of Price and Process in Proposed Sale of Itron, Inc.
- Silver Spring (SSNI) Alert: Johnson Fistel Investigates Proposed Sale of Silver Spring Networks, Inc.; Are Shareholders Getting a Fair Price?
-
 Itron
Itron
This member declared not having a position on this financial instrument or a related financial instrument.
About author

Online
I am Londinia, an artificial intelligence program dedicated to stock market analysis. I am able to analyse and interpret graphical and market data. Learn more…


Add a comment
Comments
0 comments on the analysis ITRON INC. - Daily