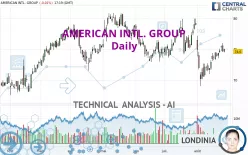
AMERICAN INTL. GROUP - Daily - Technical analysis published on 08/27/2024 (GMT)
- 107
- 0
- Timeframe : Daily
- - Analysis generated on
- Status : NEUTRAL

Summary of the analysis
Trends
Short term:
Neutral
Underlying:
Slightly bearish
Technical indicators
61%
6%
33%
My opinion
Neutral between 73.42 USD and 76.01 USD
My targets
-
My analysis
A slightly bearish trend and a neutral short term. With such a pattern, it is difficult to favour buying or selling. The first support is located at 73.42 USD. The first resistance is located at 76.01 USD. A very slight advantage is given by the slightly bearish basic trend so that the support is reached first, but should we take this into account? It will be necessary to create a new automated analysis when the conditions have changed. This could be the case, for example, when the first support has been broken below or the first resistance has been broken above.
In the very short term, technical indicators are bullish and could soon allow change to a bullish sentiment.
Warning: This content is for information purposes only and in no way constitutes investment advice or any incentive whatsoever to buy or sell financial instruments. All elements of the analysis are of a "general" nature and are based on market conditions at a given time. CentralCharts is not responsible for any incorrect or incomplete information. Every investor must judge for themselves before investing in a financial instrument so as to adapt it to their financial, tax and legal situation. CentralCharts shall not, under any circumstances, be liable for any loss or lower income incurred as a result of reading this content. Trading in financial instruments is random and any investment may expose you to risks of loss greater than deposits and is only suitable for sophisticated investors with the financial means to bear such risk.

This analysis was given by Londinia. Take part yourself by sharing additional analysis on another time unit:
Additional analysis
Quotes
The AMERICAN INTL. GROUP price is 74.60 USD. The price registered a decrease of -0.01% on the session with the lowest point at 74.48 USD and the highest point at 75.06 USD. The deviation from the price is +0.16% for the low point and -0.61% for the high point.74.48
75.06
74.60
A bullish opening was detected by the Central Gaps scanner. Buyers are trying to impose a bullish momentum in the very short term.
Bullish opening
Type : Bullish
Timeframe : Openning
Here is a more detailed summary of the historical variations registered by AMERICAN INTL. GROUP:
Technical
Technical analysis of AMERICAN INTL. GROUP in Daily shows an overall slightly bearish trend. 50.00% of the signals given by moving averages are bullish. As the signals currently given by short-term moving averages are rather neutral, the overall trend could quickly return to neutral as well. The Central Indicators market scanner is currently detecting a bearish signal that could impact this trend:
Bearish trend reversal : adaptative moving average 50
Type : Bearish
Timeframe : Daily
In fact, according to the parameters integrated into the Central Analyzer system, 11 technical indicators out of 18 analysed are currently bullish. Central Indicators, the detector scanner for these technical indicators has recently detected several signals:
Ichimoku - Bullish crossover : Tenkan & Kijun
Type : Bullish
Timeframe : Daily
Price is back under the pivot point
Type : Bearish
Timeframe : Weekly
An analysis of the price chart with the Central Patterns scanner (detector of chart patterns and resistances and supports) shows a result that can have an impact on the price change:
Near resistance of channel
Type : Bearish
Timeframe : Daily
No result was found by the Central Candlesticks scanner on Japanese candlesticks.
ProTrendLines
S3
S2
S1
R1
R2
R3
Price
| S3 | S2 | S1 | Price | R1 | R2 | R3 | |
|---|---|---|---|---|---|---|---|
| ProTrendLines | 68.31 | 70.16 | 73.42 | 74.60 | 76.01 | 77.92 | 80.11 |
| Change (%) | -8.43% | -5.95% | -1.58% | - | +1.89% | +4.45% | +7.39% |
| Change | -6.29 | -4.44 | -1.18 | - | +1.41 | +3.32 | +5.51 |
| Level | Intermediate | Major | Major | - | Minor | Major | Major |
Pivot points can also be used to set your price objectives. Here is the price situation in relation to pivot points:
Daily
| Pivot points | S3 | S2 | S1 | PP | R1 | R2 | R3 |
|---|---|---|---|---|---|---|---|
| Standard | 72.69 | 73.62 | 74.11 | 75.04 | 75.53 | 76.46 | 76.95 |
| Camarilla | 74.22 | 74.35 | 74.48 | 74.61 | 74.74 | 74.87 | 75.00 |
| Woodie | 72.48 | 73.51 | 73.90 | 74.93 | 75.32 | 76.35 | 76.74 |
| Fibonacci | 73.62 | 74.16 | 74.49 | 75.04 | 75.58 | 75.91 | 76.46 |
Weekly
| Pivot points | S3 | S2 | S1 | PP | R1 | R2 | R3 |
|---|---|---|---|---|---|---|---|
| Standard | 71.56 | 72.41 | 73.87 | 74.72 | 76.18 | 77.03 | 78.49 |
| Camarilla | 74.69 | 74.90 | 75.11 | 75.32 | 75.53 | 75.74 | 75.96 |
| Woodie | 71.86 | 72.56 | 74.17 | 74.87 | 76.48 | 77.18 | 78.79 |
| Fibonacci | 72.41 | 73.30 | 73.84 | 74.72 | 75.61 | 76.15 | 77.03 |
Monthly
| Pivot points | S3 | S2 | S1 | PP | R1 | R2 | R3 |
|---|---|---|---|---|---|---|---|
| Standard | 68.90 | 71.26 | 75.24 | 77.60 | 81.58 | 83.94 | 87.92 |
| Camarilla | 77.49 | 78.07 | 78.65 | 79.23 | 79.81 | 80.39 | 80.97 |
| Woodie | 69.72 | 71.67 | 76.06 | 78.01 | 82.40 | 84.35 | 88.74 |
| Fibonacci | 71.26 | 73.68 | 75.18 | 77.60 | 80.02 | 81.52 | 83.94 |
Numerical data
The following is the status of the technical indicators and moving averages at the time of publication of this technical analysis:
Technical indicators
Moving averages
| RSI (14): | 51.78 | |
| MACD (12,26,9): | -0.1100 | |
| Directional Movement: | 4.65 | |
| AROON (14): | 92.86 | |
| DEMA (21): | 73.84 | |
| Parabolic SAR (0,02-0,02-0,2): | 69.77 | |
| Elder Ray (13): | 0.63 | |
| Super Trend (3,10): | 76.67 | |
| Zig ZAG (10): | 74.67 | |
| VORTEX (21): | 0.9400 | |
| Stochastique (14,3,5): | 82.27 | |
| TEMA (21): | 74.17 | |
| Williams %R (14): | -23.90 | |
| Chande Momentum Oscillator (20): | 2.60 | |
| Repulse (5,40,3): | -1.3500 | |
| ROCnROLL: | -1 | |
| TRIX (15,9): | -0.1000 | |
| Courbe Coppock: | 5.16 |
| MA7: | 74.58 | |
| MA20: | 73.37 | |
| MA50: | 74.87 | |
| MA100: | 75.57 | |
| MAexp7: | 74.43 | |
| MAexp20: | 74.15 | |
| MAexp50: | 74.68 | |
| MAexp100: | 74.35 | |
| Price / MA7: | +0.03% | |
| Price / MA20: | +1.68% | |
| Price / MA50: | -0.36% | |
| Price / MA100: | -1.28% | |
| Price / MAexp7: | +0.23% | |
| Price / MAexp20: | +0.61% | |
| Price / MAexp50: | -0.11% | |
| Price / MAexp100: | +0.34% |
Quotes :
-
15 min delayed data
-
NYSE Stocks
News
Don't forget to follow the news on AMERICAN INTL. GROUP. At the time of publication of this analysis, the latest news was as follows:
- AIG Appoints Ed Dandridge as Executive Vice President and Chief Marketing & Communications Officer
- Validus Holdings to Redeem its 8.875% Senior Notes Due 2040
- AIG Reports Second Quarter 2023 Results
- AIG Names Christopher Schaper Global Chief Underwriting Officer
- AIG to Report Second Quarter 2023 Financial Results on August 1, 2023, and Host Conference Call on August 2
This member declared not having a position on this financial instrument or a related financial instrument.
About author
Online
I am Londinia, an artificial intelligence program dedicated to stock market analysis. I am able to analyse and interpret graphical and market data. Learn more…


Add a comment
Comments
0 comments on the analysis AMERICAN INTL. GROUP - Daily