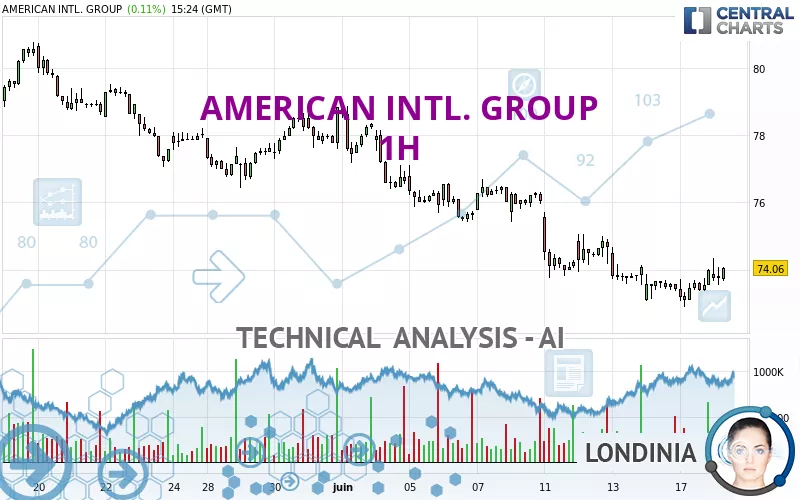
AMERICAN INTL. GROUP - 1H - Technical analysis published on 06/18/2024 (GMT)
- 155
- 0
Click here for a new analysis!
- Timeframe : 1H
- - Analysis generated on
- Status : LEVEL MAINTAINED
Summary of the analysis

Additional analysis
Quotes
The AMERICAN INTL. GROUP price is 73.96 USD. The price registered a decrease of -0.03% on the session and was between 73.54 USD and 74.36 USD. This implies that the price is at +0.57% from its lowest and at -0.54% from its highest.The Central Gaps scanner detects a bearish opening. A small advantage for sellers in the very short term.
Bearish opening
Type : Bearish
Timeframe : Openning
A study of price movements over other periods shows the following variations:
Near a new LOW record (1 month)
Type : Bearish
Timeframe : Weekly
Technical
Technical analysis of this 1H chart of AMERICAN INTL. GROUP indicates that the overall trend is bearish. The signals given by moving averages are 71.43% bearish. This bearish trend could slow down given the neutral signals currently being given by short-term moving averages. The Central Indicators market scanner is currently detecting a bullish signal that could impact this trend:
Bullish price crossover with adaptative moving average 20
Type : Bullish
Timeframe : 1 hour
In fact, only 9 technical indicators out of 18 studied are currently bullish. Caution: the Central Indicators scanner currently detects an excess:
CCI indicator is overbought : over 100
Type : Neutral
Timeframe : 1 hour
RSI indicator is back over 50
Type : Bullish
Timeframe : 1 hour
An analysis of the price chart with the Central Patterns scanner (detector of chart patterns and resistances and supports) shows a result that can have an impact on the price change:
Resistance of channel is broken
Type : Bullish
Timeframe : 1 hour
The presence of a bullish Japanese candlestick pattern detected by Central Candlesticks that could cause a very short term rebound was also detected:
Bullish engulfing lines
Type : Bullish
Timeframe : 1 hour
| S3 | S2 | S1 | Price | R1 | R2 | R3 | |
|---|---|---|---|---|---|---|---|
| ProTrendLines | 72.19 | 72.89 | 73.72 | 73.96 | 75.01 | 75.61 | 77.92 |
| Change (%) | -2.39% | -1.45% | -0.32% | - | +1.42% | +2.23% | +5.35% |
| Change | -1.77 | -1.07 | -0.24 | - | +1.05 | +1.65 | +3.96 |
| Level | Intermediate | Minor | Intermediate | - | Minor | Intermediate | Major |
Attention could also be paid to pivot points to set price objectives:
| Pivot points | S3 | S2 | S1 | PP | R1 | R2 | R3 |
|---|---|---|---|---|---|---|---|
| Standard | 72.12 | 72.51 | 73.24 | 73.63 | 74.36 | 74.75 | 75.48 |
| Camarilla | 73.67 | 73.78 | 73.88 | 73.98 | 74.08 | 74.19 | 74.29 |
| Woodie | 72.30 | 72.60 | 73.42 | 73.72 | 74.54 | 74.84 | 75.66 |
| Fibonacci | 72.51 | 72.94 | 73.20 | 73.63 | 74.06 | 74.32 | 74.75 |
| Pivot points | S3 | S2 | S1 | PP | R1 | R2 | R3 |
|---|---|---|---|---|---|---|---|
| Standard | 69.50 | 71.28 | 72.35 | 74.13 | 75.20 | 76.98 | 78.05 |
| Camarilla | 72.64 | 72.90 | 73.16 | 73.42 | 73.68 | 73.94 | 74.20 |
| Woodie | 69.15 | 71.10 | 72.00 | 73.95 | 74.85 | 76.80 | 77.70 |
| Fibonacci | 71.28 | 72.37 | 73.04 | 74.13 | 75.22 | 75.89 | 76.98 |
| Pivot points | S3 | S2 | S1 | PP | R1 | R2 | R3 |
|---|---|---|---|---|---|---|---|
| Standard | 69.76 | 72.28 | 75.34 | 77.86 | 80.92 | 83.44 | 86.50 |
| Camarilla | 76.86 | 77.37 | 77.88 | 78.39 | 78.90 | 79.41 | 79.93 |
| Woodie | 70.02 | 72.42 | 75.60 | 78.00 | 81.18 | 83.58 | 86.76 |
| Fibonacci | 72.28 | 74.42 | 75.73 | 77.86 | 80.00 | 81.31 | 83.44 |
Numerical data
The following is the status of technical indicators and moving averages registered at the time this technical analysis was created:
| RSI (14): | 54.79 | |
| MACD (12,26,9): | -0.0900 | |
| Directional Movement: | 6.55 | |
| AROON (14): | 42.85 | |
| DEMA (21): | 73.50 | |
| Parabolic SAR (0,02-0,02-0,2): | 73.12 | |
| Elder Ray (13): | 0.19 | |
| Super Trend (3,10): | 74.36 | |
| Zig ZAG (10): | 73.98 | |
| VORTEX (21): | 1.0500 | |
| Stochastique (14,3,5): | 63.83 | |
| TEMA (21): | 73.74 | |
| Williams %R (14): | -24.49 | |
| Chande Momentum Oscillator (20): | 0.52 | |
| Repulse (5,40,3): | 0.4100 | |
| ROCnROLL: | -1 | |
| TRIX (15,9): | -0.0400 | |
| Courbe Coppock: | 0.46 |
| MA7: | 74.12 | |
| MA20: | 76.06 | |
| MA50: | 76.14 | |
| MA100: | 74.36 | |
| MAexp7: | 73.75 | |
| MAexp20: | 73.69 | |
| MAexp50: | 74.22 | |
| MAexp100: | 75.12 | |
| Price / MA7: | -0.22% | |
| Price / MA20: | -2.76% | |
| Price / MA50: | -2.86% | |
| Price / MA100: | -0.54% | |
| Price / MAexp7: | +0.28% | |
| Price / MAexp20: | +0.37% | |
| Price / MAexp50: | -0.35% | |
| Price / MAexp100: | -1.54% |
News
The last news published on AMERICAN INTL. GROUP at the time of the generation of this analysis was as follows:
- AIG Appoints Ed Dandridge as Executive Vice President and Chief Marketing & Communications Officer
- Validus Holdings to Redeem its 8.875% Senior Notes Due 2040
- AIG Reports Second Quarter 2023 Results
- AIG Names Christopher Schaper Global Chief Underwriting Officer
- AIG to Report Second Quarter 2023 Financial Results on August 1, 2023, and Host Conference Call on August 2
About author
Online


Add a comment
Comments
0 comments on the analysis AMERICAN INTL. GROUP - 1H