IPSOS - Daily - Technical analysis published on 11/15/2019 (GMT)
- 362
- 0
- Who voted?
Click here for a new analysis!
- Timeframe : Daily
- - Analysis generated on
- Status : TARGET REACHED

Summary of the analysis

Additional analysis
Quotes
IPSOS rating 27.35 EUR. On the day, this instrument gained +0.92% with the lowest point at 27.05 EUR and the highest point at 27.40 EUR. The deviation from the price is +1.11% for the low point and -0.18% for the high point.Here is a more detailed summary of the historical variations registered by IPSOS:
Near a new HIGH record (1st january)
Type : Bullish
Timeframe : Weekly
Near a new HIGH record (1 month)
Type : Bullish
Timeframe : Weekly
Technical
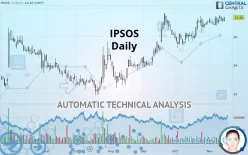
Technical analysis of IPSOS in Daily shows a strongly overall bullish trend. The signals given by the moving averages are 92.86% bullish. This strong bullish trend is confirmed by the strong signals currently being given by short-term moving averages. The Central Indicators scanner does not detect any result on moving averages that would impact this trend.
An assessment of technical indicators shows a moderate bullish signal.
Caution: the Central Indicators scanner currently detects an excess:
Williams %R indicator is overbought : over -20
Type : Neutral
Timeframe : Daily
Pivot points : price is over resistance 1
Type : Neutral
Timeframe : Daily
Pivot points : price is over resistance 1
Type : Neutral
Timeframe : Weekly
Price is back under the pivot point
Type : Bearish
Timeframe : Daily
An analysis of the price chart with the Central Patterns scanner (detector of chart patterns and resistances and supports) shows several results that can have an impact on the price change:
Near horizontal resistance
Type : Bearish
Timeframe : Daily
Resistance of channel is broken
Type : Bullish
Timeframe : Daily
Resistance of triangle is broken
Type : Bullish
Timeframe : Daily
No result was found by the Central Candlesticks scanner on Japanese candlesticks.
| S3 | S2 | S1 | Price | R1 | R2 | R3 | |
|---|---|---|---|---|---|---|---|
| ProTrendLines | 24.75 | 25.50 | 26.30 | 27.35 | 27.60 | 28.83 | 32.68 |
| Change (%) | -9.51% | -6.76% | -3.84% | - | +0.91% | +5.41% | +19.49% |
| Change | -2.60 | -1.85 | -1.05 | - | +0.25 | +1.48 | +5.33 |
| Level | Intermediate | Minor | Major | - | Intermediate | Intermediate | Intermediate |
To determine price objectives, it is also possible to use the pivot points. Here is the price position in relation to pivot points:
| Pivot points | S3 | S2 | S1 | PP | R1 | R2 | R3 |
|---|---|---|---|---|---|---|---|
| Standard | 26.73 | 26.87 | 26.98 | 27.12 | 27.23 | 27.37 | 27.48 |
| Camarilla | 27.03 | 27.05 | 27.08 | 27.10 | 27.12 | 27.15 | 27.17 |
| Woodie | 26.73 | 26.86 | 26.98 | 27.11 | 27.23 | 27.36 | 27.48 |
| Fibonacci | 26.87 | 26.96 | 27.02 | 27.12 | 27.21 | 27.27 | 27.37 |
| Pivot points | S3 | S2 | S1 | PP | R1 | R2 | R3 |
|---|---|---|---|---|---|---|---|
| Standard | 25.95 | 26.35 | 26.65 | 27.05 | 27.35 | 27.75 | 28.05 |
| Camarilla | 26.76 | 26.82 | 26.89 | 26.95 | 27.01 | 27.08 | 27.14 |
| Woodie | 25.90 | 26.33 | 26.60 | 27.03 | 27.30 | 27.73 | 28.00 |
| Fibonacci | 26.35 | 26.62 | 26.78 | 27.05 | 27.32 | 27.48 | 27.75 |
| Pivot points | S3 | S2 | S1 | PP | R1 | R2 | R3 |
|---|---|---|---|---|---|---|---|
| Standard | 23.40 | 24.30 | 25.65 | 26.55 | 27.90 | 28.80 | 30.15 |
| Camarilla | 26.38 | 26.59 | 26.79 | 27.00 | 27.21 | 27.41 | 27.62 |
| Woodie | 23.63 | 24.41 | 25.88 | 26.66 | 28.13 | 28.91 | 30.38 |
| Fibonacci | 24.30 | 25.16 | 25.69 | 26.55 | 27.41 | 27.94 | 28.80 |
Numerical data
The following is the status of technical indicators and moving averages registered at the time this technical analysis was created:
| RSI (14): | 59.73 | |
| MACD (12,26,9): | 0.2900 | |
| Directional Movement: | 13.37 | |
| AROON (14): | 71.43 | |
| DEMA (21): | 27.34 | |
| Parabolic SAR (0,02-0,02-0,2): | 26.79 | |
| Elder Ray (13): | 0.15 | |
| Super Trend (3,10): | 26.01 | |
| Zig ZAG (10): | 27.35 | |
| VORTEX (21): | 1.1400 | |
| Stochastique (14,3,5): | 68.52 | |
| TEMA (21): | 27.29 | |
| Williams %R (14): | -16.67 | |
| Chande Momentum Oscillator (20): | 0.35 | |
| Repulse (5,40,3): | 0.6500 | |
| ROCnROLL: | 1 | |
| TRIX (15,9): | 0.1700 | |
| Courbe Coppock: | 2.66 |
| MA7: | 27.20 | |
| MA20: | 27.03 | |
| MA50: | 26.38 | |
| MA100: | 24.92 | |
| MAexp7: | 27.18 | |
| MAexp20: | 26.94 | |
| MAexp50: | 26.26 | |
| MAexp100: | 25.31 | |
| Price / MA7: | +0.55% | |
| Price / MA20: | +1.18% | |
| Price / MA50: | +3.68% | |
| Price / MA100: | +9.75% | |
| Price / MAexp7: | +0.63% | |
| Price / MAexp20: | +1.52% | |
| Price / MAexp50: | +4.15% | |
| Price / MAexp100: | +8.06% |
News
The last news published on IPSOS at the time of the generation of this analysis was as follows:
- IPSOS LAUNCHES IPSOS.DIGITAL, ITS FULLY AUTOMATED RESEARCH PLATFORM
- Ipsos - Third quarter revenues 2019
- Swarovski's Consumer Goods Business partners with Ipsos MMA to deploy a global Unified Marketing Measurement program optimizing traditional media, digital and social media, and personalized marketing to drive omni-channel sales and profit
- Swarovski's Consumer Goods Business partners with Ipsos MMA to deploy a global Unified Marketing Measurement program optimizing traditional media, digital and social media, and personalized marketing to drive omni-channel sales and profit
- Ipsos MMA Announces the Next Generation of Multi-Touch Attribution by Releasing Version 2.0 of the Activate Unified Marketing Planning Platform
About author

Online


Add a comment
Comments
0 comments on the analysis IPSOS - Daily