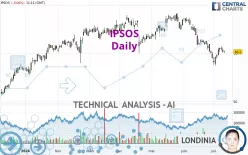
IPSOS - Daily - Technical analysis published on 07/10/2024 (GMT)
- 193
- 0
Click here for a new analysis!
- Timeframe : Daily
- - Analysis generated on
- Status : TARGET REACHED

Summary of the analysis

Additional analysis
Quotes
IPSOS rating 60.20 EUR. The price is lower by -0.08% since the last closing with the lowest point at 59.95 EUR and the highest point at 60.50 EUR. The deviation from the price is +0.42% for the low point and -0.50% for the high point.The Central Gaps scanner detects a bearish opening marking the presence of sellers ahead of buyers at the opening but not sufficiently marked to allow the price to register a quotation gap.
Bearish opening
Type : Bearish
Timeframe : Openning
A study of price movements over other periods shows the following variations:
Near a new LOW record (1 month)
Type : Bearish
Timeframe : Weekly
Technical
Technical analysis of IPSOS in Daily shows a overall strongly bearish trend. 82.14% of the signals given by moving averages are bearish. The slightly bearish signals from short-term moving averages show that the overall trend is slowing down. The Central Indicators scanner detects bearish signals on moving averages that could impact this trend:
Bearish trend reversal : Moving Average 100
Type : Bearish
Timeframe : Daily
Bearish trend reversal : adaptative moving average 20
Type : Bearish
Timeframe : Daily
Bearish price crossover with adaptative moving average 20
Type : Bearish
Timeframe : Daily
Technical indicators are slightly bullish. There is therefore considerable uncertainty about the continuation of the increase.
Central Indicators, the scanner specialised in technical indicators, has identified this signal:
Momentum indicator is back under 0
Type : Bearish
Timeframe : Daily
An analysis of the price chart with the Central Patterns scanner (detector of chart patterns and resistances and supports) shows a result that can have an impact on the price change:
Near support of channel
Type : Bullish
Timeframe : Daily
The Central Candlesticks scanner, specialised in Japanese candlesticks, did not identify any signals.
| S3 | S2 | S1 | Price | R1 | |
|---|---|---|---|---|---|
| ProTrendLines | 48.16 | 54.48 | 58.48 | 60.20 | 66.10 |
| Change (%) | -20.00% | -9.50% | -2.86% | - | +9.80% |
| Change | -12.04 | -5.72 | -1.72 | - | +5.90 |
| Level | Intermediate | Minor | Major | - | Major |
Pivot points can also be used to set your price objectives. Here is the price situation in relation to pivot points:
| Pivot points | S3 | S2 | S1 | PP | R1 | R2 | R3 |
|---|---|---|---|---|---|---|---|
| Standard | 58.72 | 59.38 | 59.82 | 60.48 | 60.92 | 61.58 | 62.02 |
| Camarilla | 59.95 | 60.05 | 60.15 | 60.25 | 60.35 | 60.45 | 60.55 |
| Woodie | 58.60 | 59.33 | 59.70 | 60.43 | 60.80 | 61.53 | 61.90 |
| Fibonacci | 59.38 | 59.80 | 60.06 | 60.48 | 60.90 | 61.16 | 61.58 |
| Pivot points | S3 | S2 | S1 | PP | R1 | R2 | R3 |
|---|---|---|---|---|---|---|---|
| Standard | 54.77 | 56.08 | 58.52 | 59.83 | 62.27 | 63.58 | 66.02 |
| Camarilla | 59.92 | 60.26 | 60.61 | 60.95 | 61.29 | 61.64 | 61.98 |
| Woodie | 55.33 | 56.36 | 59.08 | 60.11 | 62.83 | 63.86 | 66.58 |
| Fibonacci | 56.08 | 57.52 | 58.40 | 59.83 | 61.27 | 62.15 | 63.58 |
| Pivot points | S3 | S2 | S1 | PP | R1 | R2 | R3 |
|---|---|---|---|---|---|---|---|
| Standard | 46.42 | 51.84 | 54.54 | 59.96 | 62.66 | 68.08 | 70.78 |
| Camarilla | 55.02 | 55.76 | 56.51 | 57.25 | 57.99 | 58.74 | 59.48 |
| Woodie | 45.07 | 51.16 | 53.19 | 59.28 | 61.31 | 67.40 | 69.43 |
| Fibonacci | 51.84 | 54.94 | 56.86 | 59.96 | 63.06 | 64.98 | 68.08 |
Numerical data
The following are the details of the technical indicators and moving averages that were collected to generate this technical analysis:
| RSI (14): | 46.08 | |
| MACD (12,26,9): | -0.6600 | |
| Directional Movement: | -5.36 | |
| AROON (14): | 42.85 | |
| DEMA (21): | 59.46 | |
| Parabolic SAR (0,02-0,02-0,2): | 58.56 | |
| Elder Ray (13): | 0.09 | |
| Super Trend (3,10): | 61.18 | |
| Zig ZAG (10): | 60.20 | |
| VORTEX (21): | 0.8500 | |
| Stochastique (14,3,5): | 76.31 | |
| TEMA (21): | 59.41 | |
| Williams %R (14): | -28.92 | |
| Chande Momentum Oscillator (20): | -0.50 | |
| Repulse (5,40,3): | -0.1100 | |
| ROCnROLL: | -1 | |
| TRIX (15,9): | -0.2400 | |
| Courbe Coppock: | 2.37 |
| MA7: | 60.22 | |
| MA20: | 59.93 | |
| MA50: | 62.38 | |
| MA100: | 62.44 | |
| MAexp7: | 60.14 | |
| MAexp20: | 60.46 | |
| MAexp50: | 61.49 | |
| MAexp100: | 60.87 | |
| Price / MA7: | -0.03% | |
| Price / MA20: | +0.45% | |
| Price / MA50: | -3.49% | |
| Price / MA100: | -3.59% | |
| Price / MAexp7: | +0.10% | |
| Price / MAexp20: | -0.43% | |
| Price / MAexp50: | -2.10% | |
| Price / MAexp100: | -1.10% |
News
Don't forget to follow the news on IPSOS. At the time of publication of this analysis, the latest news was as follows:
- Ipsos: Monthly declaration of shares and voting rights - May 2024
- Ipsos boosts speed of data delivery with Datasmoothie’s platform
- Ipsos wins ANA B2 award for The Path insights series
- Success of the "Ipsos Partnership 2024" operation
- Ipsos: Monthly declaration of shares and voting rights - April 2024
About author
Online


Add a comment
Comments
0 comments on the analysis IPSOS - Daily