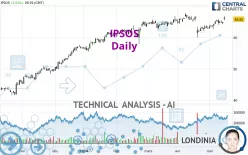
IPSOS - Daily - Technical analysis published on 05/16/2024 (GMT)
- 152
- 0
Click here for a new analysis!
- Timeframe : Daily
- - Analysis generated on
- Status : TARGET REACHED

Summary of the analysis

Additional analysis
Quotes
The IPSOS rating is 65.85 EUR. The price has increased by +2.01% since the last closing and was traded between 65.40 EUR and 66.90 EUR over the period. The price is currently at +0.69% from its lowest and -1.57% from its highest.A bullish gap was detected at the opening by the Central Gaps scanner. There are a lot of buyers and they have the upper hand in the very short term.
Opening Gap UP
Type : Bullish
Timeframe : Openning
Here is a more detailed summary of the historical variations registered by IPSOS:
Near a new HIGH record (5 years)
Type : Bullish
Timeframe : Weekly
Near a new HIGH record (1 year)
Type : Bullish
Timeframe : Weekly
Near a new HIGH record (1st january)
Type : Bullish
Timeframe : Weekly
New HIGH record (1 month)
Type : Bullish
Timeframe : Weekly
Technical
Technical analysis of this Daily chart of IPSOS indicates that the overall trend is strongly bullish. 85.71% of the signals given by moving averages are bullish. The slightly bullish signals given by the short-term moving averages show a weakening of the global trend. The Central Indicators market scanner is currently detecting a bullish signal that could impact this trend:
Bullish price crossover with Moving Average 50
Type : Bullish
Timeframe : Daily
In fact, 14 technical indicators on 18 studied are currently bullish. Caution: the Central Indicators scanner currently detects an excess:
CCI indicator is overbought : over 100
Type : Neutral
Timeframe : Daily
Williams %R indicator is overbought : over -20
Type : Neutral
Timeframe : Daily
Pivot points : price is over resistance 3
Type : Neutral
Timeframe : Daily
Ichimoku : price is over the cloud
Type : Bullish
Timeframe : Daily
Central Patterns, the market scanner focusing on chart patterns, resistances and supports found this result:
Near horizontal resistance
Type : Bearish
Timeframe : Daily
The Central Candlesticks scanner which studies Japanese candlesticks did not detect anything.
| S3 | S2 | S1 | Price | R1 | |
|---|---|---|---|---|---|
| ProTrendLines | 47.22 | 56.05 | 60.16 | 65.85 | 66.85 |
| Change (%) | -28.29% | -14.88% | -8.64% | - | +1.52% |
| Change | -18.63 | -9.80 | -5.69 | - | +1.00 |
| Level | Minor | Minor | Major | - | Major |
Pivot points can also be used to set your price objectives. Here is the price situation in relation to pivot points:
| Pivot points | S3 | S2 | S1 | PP | R1 | R2 | R3 |
|---|---|---|---|---|---|---|---|
| Standard | 63.45 | 63.85 | 64.20 | 64.60 | 64.95 | 65.35 | 65.70 |
| Camarilla | 64.34 | 64.41 | 64.48 | 64.55 | 64.62 | 64.69 | 64.76 |
| Woodie | 63.43 | 63.84 | 64.18 | 64.59 | 64.93 | 65.34 | 65.68 |
| Fibonacci | 63.85 | 64.14 | 64.31 | 64.60 | 64.89 | 65.06 | 65.35 |
| Pivot points | S3 | S2 | S1 | PP | R1 | R2 | R3 |
|---|---|---|---|---|---|---|---|
| Standard | 60.00 | 61.35 | 63.05 | 64.40 | 66.10 | 67.45 | 69.15 |
| Camarilla | 63.91 | 64.19 | 64.47 | 64.75 | 65.03 | 65.31 | 65.59 |
| Woodie | 60.18 | 61.44 | 63.23 | 64.49 | 66.28 | 67.54 | 69.33 |
| Fibonacci | 61.35 | 62.52 | 63.24 | 64.40 | 65.57 | 66.29 | 67.45 |
| Pivot points | S3 | S2 | S1 | PP | R1 | R2 | R3 |
|---|---|---|---|---|---|---|---|
| Standard | 51.53 | 55.77 | 59.33 | 63.57 | 67.13 | 71.37 | 74.93 |
| Camarilla | 60.76 | 61.47 | 62.19 | 62.90 | 63.62 | 64.33 | 65.05 |
| Woodie | 51.20 | 55.60 | 59.00 | 63.40 | 66.80 | 71.20 | 74.60 |
| Fibonacci | 55.77 | 58.75 | 60.59 | 63.57 | 66.55 | 68.39 | 71.37 |
Numerical data
The following is the status of technical indicators and moving averages registered at the time this technical analysis was created:
| RSI (14): | 59.04 | |
| MACD (12,26,9): | 0.2000 | |
| Directional Movement: | 5.21 | |
| AROON (14): | 100.00 | |
| DEMA (21): | 64.72 | |
| Parabolic SAR (0,02-0,02-0,2): | 62.07 | |
| Elder Ray (13): | 1.48 | |
| Super Trend (3,10): | 66.90 | |
| Zig ZAG (10): | 66.00 | |
| VORTEX (21): | 0.9900 | |
| Stochastique (14,3,5): | 72.67 | |
| TEMA (21): | 64.83 | |
| Williams %R (14): | -21.43 | |
| Chande Momentum Oscillator (20): | 2.80 | |
| Repulse (5,40,3): | -0.9500 | |
| ROCnROLL: | 1 | |
| TRIX (15,9): | -0.0200 | |
| Courbe Coppock: | 5.41 |
| MA7: | 65.11 | |
| MA20: | 63.96 | |
| MA50: | 64.63 | |
| MA100: | 62.56 | |
| MAexp7: | 64.98 | |
| MAexp20: | 64.55 | |
| MAexp50: | 63.97 | |
| MAexp100: | 61.59 | |
| Price / MA7: | +1.14% | |
| Price / MA20: | +2.95% | |
| Price / MA50: | +1.89% | |
| Price / MA100: | +5.26% | |
| Price / MAexp7: | +1.34% | |
| Price / MAexp20: | +2.01% | |
| Price / MAexp50: | +2.94% | |
| Price / MAexp100: | +6.92% |
News
The last news published on IPSOS at the time of the generation of this analysis was as follows:
- IPSOS: Monthly declaration of shares and voting rights - March 2024
- Ipsos: Continued momentum in Q1
- Ipsos poll reveals how people are using generative AI, and for what
- Disclosure of trading in own shares under a share buyback programme (2 April 2024)
- Disclosure of trading in own shares under a share buyback programme (25 to 28 March 2024)
About author
Online


Add a comment
Comments
0 comments on the analysis IPSOS - Daily