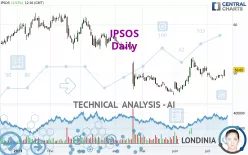
IPSOS - Daily - Technical analysis published on 07/18/2023 (GMT)
- 252
- 0
Click here for a new analysis!
- Timeframe : Daily
- - Analysis generated on
- Status : INVALID

Summary of the analysis

Additional analysis
Quotes
IPSOS rating 50.65 EUR. The price has increased by +2.53% since the last closing with the lowest point at 49.32 EUR and the highest point at 50.65 EUR. The deviation from the price is +2.70% for the low point and 0% for the high point.A bearish opening was detected by the Central Gaps scanner. Sellers are trying to impose a bearish trend in the very short term.
Bearish opening
Type : Bearish
Timeframe : Openning
So that you have an overall view of the price change, here is a table showing the variations over several periods:
Near a new LOW record (1 month)
Type : Bearish
Timeframe : Weekly
Technical
Technical analysis of this Daily chart of IPSOS indicates that the overall trend is bullish. The signals returned by the moving averages are 64.29% bullish. This bullish trend is reinforced by the strong signals currently being given by short-term moving averages. An assessment of moving averages reveals a bullish signal that could impact this trend:
Bullish price crossover with adaptative moving average 100
Type : Bullish
Timeframe : Daily
The technical indicators are bullish. There is still some doubt about the price increase.
But beware of excesses. The Central Indicators scanner currently detects this:
CCI indicator is overbought : over 100
Type : Neutral
Timeframe : Daily
Williams %R indicator is overbought : over -20
Type : Neutral
Timeframe : Daily
Pivot points : price is over resistance 2
Type : Neutral
Timeframe : Weekly
Pivot points : price is over resistance 3
Type : Neutral
Timeframe : Daily
MACD crosses UP its Moving Average
Type : Bullish
Timeframe : Daily
Parabolic SAR indicator bullish reversal
Type : Bullish
Timeframe : Daily
Ichimoku : price is over the cloud
Type : Bullish
Timeframe : Daily
The Central Patterns scanner, which studies chart patterns, resistances and supports, has identified this signal:
Resistance of channel is broken
Type : Bullish
Timeframe : Daily
For a small rebound in the very short term, the Central Candlesticks scanner currently notes the presence of this bullish pattern in Japanese candlesticks:
Bullish engulfing lines
Type : Bullish
Timeframe : Daily
| S3 | S2 | S1 | Price | R1 | R2 | R3 | |
|---|---|---|---|---|---|---|---|
| ProTrendLines | 43.69 | 46.41 | 49.55 | 50.65 | 51.45 | 53.93 | 56.04 |
| Change (%) | -13.74% | -8.37% | -2.17% | - | +1.58% | +6.48% | +10.64% |
| Change | -6.96 | -4.24 | -1.10 | - | +0.80 | +3.28 | +5.39 |
| Level | Major | Intermediate | Intermediate | - | Minor | Minor | Minor |
Pivot points can also be used to set your price objectives. Here is the price situation in relation to pivot points:
| Pivot points | S3 | S2 | S1 | PP | R1 | R2 | R3 |
|---|---|---|---|---|---|---|---|
| Standard | 48.30 | 48.56 | 48.98 | 49.24 | 49.66 | 49.92 | 50.34 |
| Camarilla | 49.21 | 49.28 | 49.34 | 49.40 | 49.46 | 49.53 | 49.59 |
| Woodie | 48.38 | 48.60 | 49.06 | 49.28 | 49.74 | 49.96 | 50.42 |
| Fibonacci | 48.56 | 48.82 | 48.98 | 49.24 | 49.50 | 49.66 | 49.92 |
| Pivot points | S3 | S2 | S1 | PP | R1 | R2 | R3 |
|---|---|---|---|---|---|---|---|
| Standard | 47.46 | 47.96 | 48.70 | 49.20 | 49.94 | 50.44 | 51.18 |
| Camarilla | 49.10 | 49.21 | 49.33 | 49.44 | 49.55 | 49.67 | 49.78 |
| Woodie | 47.58 | 48.02 | 48.82 | 49.26 | 50.06 | 50.50 | 51.30 |
| Fibonacci | 47.96 | 48.43 | 48.73 | 49.20 | 49.67 | 49.97 | 50.44 |
| Pivot points | S3 | S2 | S1 | PP | R1 | R2 | R3 |
|---|---|---|---|---|---|---|---|
| Standard | 38.51 | 41.63 | 45.61 | 48.73 | 52.71 | 55.83 | 59.81 |
| Camarilla | 47.65 | 48.30 | 48.95 | 49.60 | 50.25 | 50.90 | 51.55 |
| Woodie | 38.95 | 41.85 | 46.05 | 48.95 | 53.15 | 56.05 | 60.25 |
| Fibonacci | 41.63 | 44.34 | 46.01 | 48.73 | 51.44 | 53.11 | 55.83 |
Numerical data
The following is the status of technical indicators and moving averages registered at the time this technical analysis was created:
| RSI (14): | 63.64 | |
| MACD (12,26,9): | 0.4100 | |
| Directional Movement: | 13.57 | |
| AROON (14): | 57.14 | |
| DEMA (21): | 49.72 | |
| Parabolic SAR (0,02-0,02-0,2): | 47.94 | |
| Elder Ray (13): | 0.56 | |
| Super Trend (3,10): | 47.82 | |
| Zig ZAG (10): | 50.60 | |
| VORTEX (21): | 0.8900 | |
| Stochastique (14,3,5): | 76.91 | |
| TEMA (21): | 49.98 | |
| Williams %R (14): | 0.00 | |
| Chande Momentum Oscillator (20): | 1.00 | |
| Repulse (5,40,3): | 3.9200 | |
| ROCnROLL: | 1 | |
| TRIX (15,9): | 0.1400 | |
| Courbe Coppock: | 0.51 |
| MA7: | 49.46 | |
| MA20: | 49.30 | |
| MA50: | 47.76 | |
| MA100: | 50.73 | |
| MAexp7: | 49.63 | |
| MAexp20: | 49.17 | |
| MAexp50: | 49.05 | |
| MAexp100: | 50.05 | |
| Price / MA7: | +2.41% | |
| Price / MA20: | +2.74% | |
| Price / MA50: | +6.05% | |
| Price / MA100: | -0.16% | |
| Price / MAexp7: | +2.06% | |
| Price / MAexp20: | +3.01% | |
| Price / MAexp50: | +3.26% | |
| Price / MAexp100: | +1.20% |
News
The last news published on IPSOS at the time of the generation of this analysis was as follows:
- Ipsos acquires Big Village Australia
- IPSOS: Monthly declaration of shares and voting rights - April 2023
- Disclosure of trading in own shares under a share buyback programme (1 to 5 May 2023)
- IPSOS: Monthly declaration of shares and voting rights - March 2023
- Clifford Young, President of Ipsos U.S. Public Affairs, joins the Ad Council's Board of Directors
About author
Online


Add a comment
Comments
0 comments on the analysis IPSOS - Daily