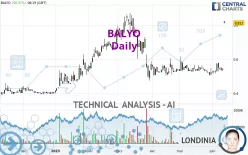
BALYO - Daily - Technical analysis published on 06/15/2023 (GMT)
- 203
- 0
Click here for a new analysis!
- Timeframe : Daily
- - Analysis generated on
- Status : LEVEL MAINTAINED

Summary of the analysis

Additional analysis
Quotes
BALYO rating 0.8120 EUR. The price registered an increase of +50.37% on the session with the lowest point at 0.8100 EUR and the highest point at 0.8240 EUR. The deviation from the price is +0.25% for the low point and -1.46% for the high point.A bullish gap was detected at the opening by the Central Gaps scanner. There are a lot of buyers and they have the upper hand in the very short term.
Opening Gap UP
Type : Bullish
Timeframe : Openning
A study of price movements over other periods shows the following variations:
New HIGH record (1 month)
Type : Bullish
Timeframe : Weekly
Technical
Technical analysis of BALYO in Daily shows an overall bullish trend. 78.57% of the signals given by moving averages are bullish. The overall trend is reinforced by the strong bullish signals from short-term moving averages. The Central Indicators market scanner is currently detecting several bullish signals that could impact this trend:
Bullish trend reversal : Moving Average 50
Type : Bullish
Timeframe : Daily
Moving Average bullish crossovers : MA20 & MA50
Type : Bullish
Timeframe : Daily
Moving Average bullish crossovers : AMA50 & AMA100
Type : Bullish
Timeframe : Daily
Bullish price crossover with Moving Average 100
Type : Bullish
Timeframe : Daily
Bullish price crossover with adaptative moving average 20
Type : Bullish
Timeframe : Daily
Bullish price crossover with adaptative moving average 50
Type : Bullish
Timeframe : Daily
Bullish price crossover with adaptative moving average 100
Type : Bullish
Timeframe : Daily
The probability of a further increase is high given the direction of the technical indicators.
Caution: the Central Indicators scanner currently detects an excess:
RSI indicator is overbought : over 80
Type : Neutral
Timeframe : Daily
CCI indicator is overbought : over 100
Type : Neutral
Timeframe : Daily
Williams %R indicator is overbought : over -20
Type : Neutral
Timeframe : Daily
Pivot points : price is over resistance 3
Type : Neutral
Timeframe : Daily
Pivot points : price is over resistance 3
Type : Neutral
Timeframe : Weekly
Ichimoku : price is over the cloud
Type : Bullish
Timeframe : Daily
SuperTrend indicator bullish reversal
Type : Bullish
Timeframe : Daily
MACD indicator is back over 0
Type : Bullish
Timeframe : Daily
Central Patterns, the market scanner focusing on chart patterns, resistances and supports found these results:
Horizontal resistance is broken
Type : Bullish
Timeframe : Daily
Resistance of channel is broken
Type : Bullish
Timeframe : Daily
No result was found by the Central Candlesticks scanner on Japanese candlesticks.
| S3 | S2 | S1 | Price | R1 | R2 | R3 | |
|---|---|---|---|---|---|---|---|
| ProTrendLines | 0.5716 | 0.6670 | 0.7400 | 0.8120 | 0.8450 | 1.4048 | 2.2600 |
| Change (%) | -29.61% | -17.86% | -8.87% | - | +4.06% | +73.00% | +178.33% |
| Change | -0.2404 | -0.1450 | -0.0720 | - | +0.0330 | +0.5928 | +1.4480 |
| Level | Major | Minor | Minor | - | Major | Minor | Minor |
Attention could also be paid to pivot points to set price objectives:
| Pivot points | S3 | S2 | S1 | PP | R1 | R2 | R3 |
|---|---|---|---|---|---|---|---|
| Standard | 0.5170 | 0.5240 | 0.5320 | 0.5390 | 0.5470 | 0.5540 | 0.5620 |
| Camarilla | 0.5359 | 0.5373 | 0.5386 | 0.5400 | 0.5414 | 0.5428 | 0.5441 |
| Woodie | 0.5175 | 0.5243 | 0.5325 | 0.5393 | 0.5475 | 0.5543 | 0.5625 |
| Fibonacci | 0.5240 | 0.5297 | 0.5333 | 0.5390 | 0.5447 | 0.5483 | 0.5540 |
| Pivot points | S3 | S2 | S1 | PP | R1 | R2 | R3 |
|---|---|---|---|---|---|---|---|
| Standard | 0.4490 | 0.4830 | 0.5100 | 0.5440 | 0.5710 | 0.6050 | 0.6320 |
| Camarilla | 0.5202 | 0.5258 | 0.5314 | 0.5370 | 0.5426 | 0.5482 | 0.5538 |
| Woodie | 0.4455 | 0.4813 | 0.5065 | 0.5423 | 0.5675 | 0.6033 | 0.6285 |
| Fibonacci | 0.4830 | 0.5063 | 0.5207 | 0.5440 | 0.5673 | 0.5817 | 0.6050 |
| Pivot points | S3 | S2 | S1 | PP | R1 | R2 | R3 |
|---|---|---|---|---|---|---|---|
| Standard | 0.3690 | 0.4370 | 0.4800 | 0.5480 | 0.5910 | 0.6590 | 0.7020 |
| Camarilla | 0.4925 | 0.5027 | 0.5128 | 0.5230 | 0.5332 | 0.5434 | 0.5535 |
| Woodie | 0.3565 | 0.4308 | 0.4675 | 0.5418 | 0.5785 | 0.6528 | 0.6895 |
| Fibonacci | 0.4370 | 0.4794 | 0.5056 | 0.5480 | 0.5904 | 0.6166 | 0.6590 |
Numerical data
The following are the details of the technical indicators and moving averages that were collected to generate this technical analysis:
| RSI (14): | 81.55 | |
| MACD (12,26,9): | 0.0194 | |
| Directional Movement: | 52.8557 | |
| AROON (14): | 71.4286 | |
| DEMA (21): | 0.5831 | |
| Parabolic SAR (0,02-0,02-0,2): | 0.5120 | |
| Elder Ray (13): | 0.2379 | |
| Super Trend (3,10): | 0.6711 | |
| Zig ZAG (10): | 0.8120 | |
| VORTEX (21): | 1.0218 | |
| Stochastique (14,3,5): | 62.67 | |
| TEMA (21): | 0.6113 | |
| Williams %R (14): | -3.76 | |
| Chande Momentum Oscillator (20): | 0.2800 | |
| Repulse (5,40,3): | -2.4526 | |
| ROCnROLL: | 1 | |
| TRIX (15,9): | -0.0104 | |
| Courbe Coppock: | 19.27 |
| MA7: | 0.5841 | |
| MA20: | 0.5514 | |
| MA50: | 0.5455 | |
| MA100: | 0.6038 | |
| MAexp7: | 0.6108 | |
| MAexp20: | 0.5663 | |
| MAexp50: | 0.5653 | |
| MAexp100: | 0.5721 | |
| Price / MA7: | +39.02% | |
| Price / MA20: | +47.26% | |
| Price / MA50: | +48.85% | |
| Price / MA100: | +34.48% | |
| Price / MAexp7: | +32.94% | |
| Price / MAexp20: | +43.39% | |
| Price / MAexp50: | +43.64% | |
| Price / MAexp100: | +41.93% |
News
Don't forget to follow the news on BALYO. At the time of publication of this analysis, the latest news was as follows:
- Proposed Tender Offer From SoftBank Group to Acquire Balyo’s Shares
- BALYO Announces Its Q1 2023 Sales at €7.2m, up By +87%
- BALYO Announces Full Year 2022 Results
- BALYO Announces Its Sales for 2022 at €24.1 million, an Increase of +11% and Q4 Growth in Order Intake of +108% to €10.6 Million vs. Q4 2021
- BALYO selected by the Danone Group to convert one of its factories to autonomy with a fleet of driverless "REACHY" forklifts
About author
Online


Add a comment
Comments
0 comments on the analysis BALYO - Daily