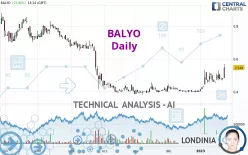
BALYO - Daily - Technical analysis published on 01/24/2023 (GMT)
- 178
- 0
Click here for a new analysis!
- Timeframe : Daily
- - Analysis generated on
- Status : TARGET REACHED

Summary of the analysis

Additional analysis
Quotes
The BALYO price is 0.5480 EUR. On the day, this instrument gained +13.46% and was traded between 0.4830 EUR and 0.5700 EUR over the period. The price is currently at +13.46% from its lowest and -3.86% from its highest.Here is a more detailed summary of the historical variations registered by BALYO:
New HIGH record (1st january)
Type : Bullish
Timeframe : Weekly
New HIGH record (1 month)
Type : Bullish
Timeframe : Weekly
The Central Volumes scanner detects abnormal volumes on the asset:
Abnormal volumes
Timeframe : 20 days
Technical
Technical analysis of BALYO in Daily shows an overall bullish trend. 71.43% of the signals given by moving averages are bullish. The overall trend is reinforced by the strong bullish signals from short-term moving averages. The Central Indicators market scanner currently does not detect any result that concerns moving averages.
In fact, 17 technical indicators on 18 studied are currently bullish. Caution: the Central Indicators scanner currently detects an excess:
RSI indicator is overbought : over 70
Type : Neutral
Timeframe : Daily
CCI indicator is overbought : over 100
Type : Neutral
Timeframe : Daily
Williams %R indicator is overbought : over -20
Type : Neutral
Timeframe : Daily
Pivot points : price is over resistance 1
Type : Neutral
Timeframe : Weekly
Pivot points : price is over resistance 3
Type : Neutral
Timeframe : Daily
Parabolic SAR indicator bullish reversal
Type : Bullish
Timeframe : Daily
Momentum indicator is back over 0
Type : Bullish
Timeframe : Daily
The Central Patterns scanner, which studies chart patterns, resistances and supports, has identified these signals:
Horizontal resistance is broken
Type : Bullish
Timeframe : Daily
Resistance of channel is broken
Type : Bullish
Timeframe : Daily
Central Candlesticks, the scanner specialised in Japanese candlesticks, detects these bullish signals that could support the hypothesis of a small rebound in the very short term:
White line without lower shadow
Type : Bullish
Timeframe : Daily
Long white line
Type : Bullish
Timeframe : Daily
| S3 | S2 | S1 | Price | R1 | R2 | R3 | |
|---|---|---|---|---|---|---|---|
| ProTrendLines | 0.3907 | 0.4558 | 0.5020 | 0.5480 | 0.6500 | 0.7020 | 0.8445 |
| Change (%) | -28.70% | -16.82% | -8.39% | - | +18.61% | +28.10% | +54.11% |
| Change | -0.1573 | -0.0922 | -0.0460 | - | +0.1020 | +0.1540 | +0.2965 |
| Level | Major | Intermediate | Intermediate | - | Minor | Minor | Intermediate |
To determine price objectives, it is also possible to use the pivot points. Here is the price position in relation to pivot points:
| Pivot points | S3 | S2 | S1 | PP | R1 | R2 | R3 |
|---|---|---|---|---|---|---|---|
| Standard | 0.4622 | 0.4663 | 0.4747 | 0.4788 | 0.4872 | 0.4913 | 0.4997 |
| Camarilla | 0.4796 | 0.4807 | 0.4819 | 0.4830 | 0.4842 | 0.4853 | 0.4864 |
| Woodie | 0.4643 | 0.4674 | 0.4768 | 0.4799 | 0.4893 | 0.4924 | 0.5018 |
| Fibonacci | 0.4663 | 0.4711 | 0.4741 | 0.4788 | 0.4836 | 0.4866 | 0.4913 |
| Pivot points | S3 | S2 | S1 | PP | R1 | R2 | R3 |
|---|---|---|---|---|---|---|---|
| Standard | 0.3713 | 0.4137 | 0.4453 | 0.4877 | 0.5193 | 0.5617 | 0.5933 |
| Camarilla | 0.4567 | 0.4634 | 0.4702 | 0.4770 | 0.4838 | 0.4906 | 0.4974 |
| Woodie | 0.3660 | 0.4110 | 0.4400 | 0.4850 | 0.5140 | 0.5590 | 0.5880 |
| Fibonacci | 0.4137 | 0.4419 | 0.4594 | 0.4877 | 0.5159 | 0.5334 | 0.5617 |
| Pivot points | S3 | S2 | S1 | PP | R1 | R2 | R3 |
|---|---|---|---|---|---|---|---|
| Standard | 0.3357 | 0.3653 | 0.3857 | 0.4153 | 0.4357 | 0.4653 | 0.4857 |
| Camarilla | 0.3923 | 0.3968 | 0.4014 | 0.4060 | 0.4106 | 0.4152 | 0.4198 |
| Woodie | 0.3310 | 0.3630 | 0.3810 | 0.4130 | 0.4310 | 0.4630 | 0.4810 |
| Fibonacci | 0.3653 | 0.3844 | 0.3962 | 0.4153 | 0.4344 | 0.4462 | 0.4653 |
Numerical data
The following is the status of technical indicators and moving averages registered at the time this technical analysis was created:
| RSI (14): | 70.61 | |
| MACD (12,26,9): | 0.0219 | |
| Directional Movement: | 40.9219 | |
| AROON (14): | 100.0000 | |
| DEMA (21): | 0.4961 | |
| Parabolic SAR (0,02-0,02-0,2): | 0.4560 | |
| Elder Ray (13): | 0.0448 | |
| Super Trend (3,10): | 0.4255 | |
| Zig ZAG (10): | 0.5480 | |
| VORTEX (21): | 1.0881 | |
| Stochastique (14,3,5): | 62.03 | |
| TEMA (21): | 0.5107 | |
| Williams %R (14): | -17.60 | |
| Chande Momentum Oscillator (20): | 0.0750 | |
| Repulse (5,40,3): | 11.2104 | |
| ROCnROLL: | 1 | |
| TRIX (15,9): | 0.6003 | |
| Courbe Coppock: | 28.59 |
| MA7: | 0.4886 | |
| MA20: | 0.4635 | |
| MA50: | 0.4324 | |
| MA100: | 0.4622 | |
| MAexp7: | 0.4959 | |
| MAexp20: | 0.4695 | |
| MAexp50: | 0.4540 | |
| MAexp100: | 0.4997 | |
| Price / MA7: | +12.16% | |
| Price / MA20: | +18.23% | |
| Price / MA50: | +26.73% | |
| Price / MA100: | +18.56% | |
| Price / MAexp7: | +10.51% | |
| Price / MAexp20: | +16.72% | |
| Price / MAexp50: | +20.70% | |
| Price / MAexp100: | +9.67% |
News
The latest news and videos published on BALYO at the time of the analysis were as follows:
- BALYO selected by the Danone Group to convert one of its factories to autonomy with a fleet of driverless "REACHY" forklifts
- BALYO Announces Its Financial Agenda For 2023
- BALYO selected by the Behr Paint Company to convert four distribution centers with a fleet of driverless "REACHY" forklifts
- BALYO announces its sales for the 3rd quarter of 2022, at €4.3 million
- BALYO Announces Its 2022 Half-year Results
About author
Online


Add a comment
Comments
0 comments on the analysis BALYO - Daily