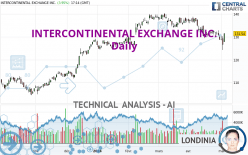
INTERCONTINENTAL EXCHANGE INC. - Daily - Technical analysis published on 05/03/2024 (GMT)
- 84
- 0
Click here for a new analysis!
- Timeframe : Daily
- - Analysis generated on
- Status : INVALID

Summary of the analysis

Additional analysis
Quotes
The INTERCONTINENTAL EXCHANGE INC. rating is 131.54 USD. The price registered an increase of +3.95% on the session and was traded between 127.80 USD and 131.68 USD over the period. The price is currently at +2.93% from its lowest and -0.11% from its highest.The Central Gaps scanner detects a bullish opening marking the presence of buyers ahead of sellers at the opening but not sufficiently marked to allow the price to register a quotation gap.
Bullish opening
Type : Bullish
Timeframe : Openning
Here is a more detailed summary of the historical variations registered by INTERCONTINENTAL EXCHANGE INC.:
Near a new LOW record (1st january)
Type : Bearish
Timeframe : Weekly
Near a new LOW record (1 month)
Type : Bearish
Timeframe : Weekly
Technical
Technical analysis of this Daily chart of INTERCONTINENTAL EXCHANGE INC. indicates that the overall trend is not clearly defined. The trend could quickly turn bearish due to the strong bearish signals currently being given by short-term moving averages. An assessment of moving averages reveals a bullish signal that could impact this trend:
Bullish price crossover with Moving Average 100
Type : Bullish
Timeframe : Daily
An assessment of technical indicators does not currently provide any relevant information to suggest whether the signal given by the technical indicators is more bullish or bearish.
But beware of excesses. The Central Indicators scanner currently detects this:
Previous candle closed under Bollinger bands
Type : Neutral
Timeframe : Daily
CCI indicator: bullish divergence
Type : Bullish
Timeframe : Daily
Williams %R indicator is overbought : over -20
Type : Neutral
Timeframe : Daily
Pivot points : price is over resistance 1
Type : Neutral
Timeframe : Daily
Price is back under the pivot point
Type : Bearish
Timeframe : Weekly
Momentum indicator is back over 0
Type : Bullish
Timeframe : Daily
Central Patterns, the market scanner focusing on chart patterns, resistances and supports found these results:
Near resistance of channel
Type : Bearish
Timeframe : Daily
Horizontal resistance is broken
Type : Bullish
Timeframe : Daily
No result was found by the Central Candlesticks scanner on Japanese candlesticks.
| S3 | S2 | S1 | Price | R1 | R2 | |
|---|---|---|---|---|---|---|
| ProTrendLines | 112.22 | 117.35 | 129.90 | 131.54 | 134.52 | 138.98 |
| Change (%) | -14.69% | -10.79% | -1.25% | - | +2.27% | +5.66% |
| Change | -19.32 | -14.19 | -1.64 | - | +2.98 | +7.44 |
| Level | Intermediate | Major | Major | - | Major | Major |
Pivot points can also be used to set your price objectives. Here is the price situation in relation to pivot points:
| Pivot points | S3 | S2 | S1 | PP | R1 | R2 | R3 |
|---|---|---|---|---|---|---|---|
| Standard | 117.99 | 121.17 | 123.85 | 127.03 | 129.71 | 132.89 | 135.57 |
| Camarilla | 124.93 | 125.47 | 126.00 | 126.54 | 127.08 | 127.61 | 128.15 |
| Woodie | 117.75 | 121.05 | 123.61 | 126.91 | 129.47 | 132.77 | 135.33 |
| Fibonacci | 121.17 | 123.41 | 124.79 | 127.03 | 129.27 | 130.65 | 132.89 |
| Pivot points | S3 | S2 | S1 | PP | R1 | R2 | R3 |
|---|---|---|---|---|---|---|---|
| Standard | 128.32 | 129.37 | 130.54 | 131.59 | 132.76 | 133.81 | 134.98 |
| Camarilla | 131.09 | 131.29 | 131.50 | 131.70 | 131.90 | 132.11 | 132.31 |
| Woodie | 128.37 | 129.40 | 130.59 | 131.62 | 132.81 | 133.84 | 135.03 |
| Fibonacci | 129.37 | 130.22 | 130.75 | 131.59 | 132.44 | 132.97 | 133.81 |
| Pivot points | S3 | S2 | S1 | PP | R1 | R2 | R3 |
|---|---|---|---|---|---|---|---|
| Standard | 115.25 | 121.99 | 125.38 | 132.12 | 135.51 | 142.25 | 145.64 |
| Camarilla | 125.97 | 126.90 | 127.83 | 128.76 | 129.69 | 130.62 | 131.55 |
| Woodie | 113.57 | 121.15 | 123.70 | 131.28 | 133.83 | 141.41 | 143.96 |
| Fibonacci | 121.99 | 125.86 | 128.25 | 132.12 | 135.99 | 138.38 | 142.25 |
Numerical data
The following is the status of technical indicators and moving averages registered at the time this technical analysis was created:
| RSI (14): | 47.45 | |
| MACD (12,26,9): | -1.5300 | |
| Directional Movement: | -14.49 | |
| AROON (14): | -92.86 | |
| DEMA (21): | 129.67 | |
| Parabolic SAR (0,02-0,02-0,2): | 132.19 | |
| Elder Ray (13): | -0.98 | |
| Super Trend (3,10): | 134.24 | |
| Zig ZAG (10): | 131.53 | |
| VORTEX (21): | 0.7800 | |
| Stochastique (14,3,5): | 36.39 | |
| TEMA (21): | 128.63 | |
| Williams %R (14): | -15.01 | |
| Chande Momentum Oscillator (20): | 0.85 | |
| Repulse (5,40,3): | 1.2800 | |
| ROCnROLL: | -1 | |
| TRIX (15,9): | -0.1600 | |
| Courbe Coppock: | 4.48 |
| MA7: | 129.98 | |
| MA20: | 131.58 | |
| MA50: | 134.92 | |
| MA100: | 131.25 | |
| MAexp7: | 129.95 | |
| MAexp20: | 131.56 | |
| MAexp50: | 132.53 | |
| MAexp100: | 129.67 | |
| Price / MA7: | +1.20% | |
| Price / MA20: | -0.03% | |
| Price / MA50: | -2.51% | |
| Price / MA100: | +0.22% | |
| Price / MAexp7: | +1.22% | |
| Price / MAexp20: | -0.02% | |
| Price / MAexp50: | -0.75% | |
| Price / MAexp100: | +1.44% |
News
The last news published on INTERCONTINENTAL EXCHANGE INC. at the time of the generation of this analysis was as follows:
- Intercontinental Exchange Chair & CEO Jeffrey C. Sprecher to Present at the Goldman Sachs U.S. Financial Services Conference on December 5
- ICE First Look at Monthly Mortgage Performance: Delinquencies Rose in September While Foreclosure Activity Remained Muted
- Black Knight: As Home Prices Set Yet Another Record in August, Pushing Annual Growth Rate Sharply Higher, Small but Active Cash-Out Refinance Market Defies Traditional Analysis
- ICE Announces Record Trading Activity in Dubai and Murban Crude As Participants Utilize ICE’s Global Oil Complex to Manage Crude Flows
- Intercontinental Exchange, Black Knight and the Federal Trade Commission Jointly Agree to Dismiss Federal Court Case, Pending Settlement Negotiations
About author
Online


Add a comment
Comments
0 comments on the analysis INTERCONTINENTAL EXCHANGE INC. - Daily