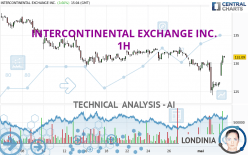
INTERCONTINENTAL EXCHANGE INC. - 1H - Technical analysis published on 05/03/2024 (GMT)
- 84
- 0
Click here for a new analysis!
- Timeframe : 1H
- - Analysis generated on
- Status : TARGET REACHED

Summary of the analysis

Additional analysis
Quotes
The INTERCONTINENTAL EXCHANGE INC. price is 131.04 USD. On the day, this instrument gained +3.56% with the lowest point at 127.80 USD and the highest point at 131.41 USD. The deviation from the price is +2.54% for the low point and -0.28% for the high point.The Central Gaps scanner detects a bullish opening. A small advantage for buyers in the very short term.
Bullish opening
Type : Bullish
Timeframe : Openning
Here is a more detailed summary of the historical variations registered by INTERCONTINENTAL EXCHANGE INC.:
Near a new LOW record (1st january)
Type : Bearish
Timeframe : Weekly
Near a new LOW record (1 month)
Type : Bearish
Timeframe : Weekly
Technical
A technical analysis in 1H of this INTERCONTINENTAL EXCHANGE INC. chart shows a neutral trend. The strong bullish signals currently being given by short-term moving averages could allow the overall trend to return to bullish. The Central Indicators scanner detects bullish signals on moving averages that could impact this trend:
Bullish trend reversal : adaptative moving average 20
Type : Bullish
Timeframe : 1 hour
Bullish trend reversal : adaptative moving average 50
Type : Bullish
Timeframe : 1 hour
Bullish price crossover with Moving Average 50
Type : Bullish
Timeframe : 1 hour
Bullish price crossover with Moving Average 100
Type : Bullish
Timeframe : 1 hour
Bullish price crossover with adaptative moving average 100
Type : Bullish
Timeframe : 1 hour
The technical indicators are bullish. There is still some doubt about the price increase.
But beware of excesses. The Central Indicators scanner currently detects this:
Williams %R indicator is overbought : over -20
Type : Neutral
Timeframe : 1 hour
Pivot points : price is over resistance 1
Type : Neutral
Timeframe : 1 hour
Aroon indicator bullish trend
Type : Bullish
Timeframe : 1 hour
Price is back under the pivot point
Type : Bearish
Timeframe : Weekly
The Central Patterns scanner, which studies chart patterns, resistances and supports, has identified these signals:
Horizontal resistance is broken
Type : Bullish
Timeframe : 1 hour
Resistance of channel is broken
Type : Bullish
Timeframe : 1 hour
No result was found by the Central Candlesticks scanner on Japanese candlesticks.
| S3 | S2 | S1 | Price | R1 | R2 | R3 | |
|---|---|---|---|---|---|---|---|
| ProTrendLines | 117.35 | 124.34 | 129.90 | 131.04 | 132.40 | 134.52 | 136.03 |
| Change (%) | -10.45% | -5.11% | -0.87% | - | +1.04% | +2.66% | +3.81% |
| Change | -13.69 | -6.70 | -1.14 | - | +1.36 | +3.48 | +4.99 |
| Level | Major | Intermediate | Major | - | Minor | Major | Intermediate |
Pivot points can also be used to set your price objectives. Here is the price situation in relation to pivot points:
| Pivot points | S3 | S2 | S1 | PP | R1 | R2 | R3 |
|---|---|---|---|---|---|---|---|
| Standard | 117.99 | 121.17 | 123.85 | 127.03 | 129.71 | 132.89 | 135.57 |
| Camarilla | 124.93 | 125.47 | 126.00 | 126.54 | 127.08 | 127.61 | 128.15 |
| Woodie | 117.75 | 121.05 | 123.61 | 126.91 | 129.47 | 132.77 | 135.33 |
| Fibonacci | 121.17 | 123.41 | 124.79 | 127.03 | 129.27 | 130.65 | 132.89 |
| Pivot points | S3 | S2 | S1 | PP | R1 | R2 | R3 |
|---|---|---|---|---|---|---|---|
| Standard | 128.32 | 129.37 | 130.54 | 131.59 | 132.76 | 133.81 | 134.98 |
| Camarilla | 131.09 | 131.29 | 131.50 | 131.70 | 131.90 | 132.11 | 132.31 |
| Woodie | 128.37 | 129.40 | 130.59 | 131.62 | 132.81 | 133.84 | 135.03 |
| Fibonacci | 129.37 | 130.22 | 130.75 | 131.59 | 132.44 | 132.97 | 133.81 |
| Pivot points | S3 | S2 | S1 | PP | R1 | R2 | R3 |
|---|---|---|---|---|---|---|---|
| Standard | 115.25 | 121.99 | 125.38 | 132.12 | 135.51 | 142.25 | 145.64 |
| Camarilla | 125.97 | 126.90 | 127.83 | 128.76 | 129.69 | 130.62 | 131.55 |
| Woodie | 113.57 | 121.15 | 123.70 | 131.28 | 133.83 | 141.41 | 143.96 |
| Fibonacci | 121.99 | 125.86 | 128.25 | 132.12 | 135.99 | 138.38 | 142.25 |
Numerical data
The following is the status of technical indicators and moving averages registered at the time this technical analysis was created:
| RSI (14): | 59.87 | |
| MACD (12,26,9): | -0.6500 | |
| Directional Movement: | 5.05 | |
| AROON (14): | 50.00 | |
| DEMA (21): | 127.59 | |
| Parabolic SAR (0,02-0,02-0,2): | 124.46 | |
| Elder Ray (13): | 2.14 | |
| Super Trend (3,10): | 126.20 | |
| Zig ZAG (10): | 131.15 | |
| VORTEX (21): | 0.9500 | |
| Stochastique (14,3,5): | 75.14 | |
| TEMA (21): | 127.56 | |
| Williams %R (14): | -5.02 | |
| Chande Momentum Oscillator (20): | 1.08 | |
| Repulse (5,40,3): | 2.2200 | |
| ROCnROLL: | 1 | |
| TRIX (15,9): | -0.1100 | |
| Courbe Coppock: | 2.86 |
| MA7: | 129.93 | |
| MA20: | 131.54 | |
| MA50: | 134.91 | |
| MA100: | 131.24 | |
| MAexp7: | 128.47 | |
| MAexp20: | 128.54 | |
| MAexp50: | 129.77 | |
| MAexp100: | 130.99 | |
| Price / MA7: | +0.85% | |
| Price / MA20: | -0.38% | |
| Price / MA50: | -2.87% | |
| Price / MA100: | -0.15% | |
| Price / MAexp7: | +2.00% | |
| Price / MAexp20: | +1.94% | |
| Price / MAexp50: | +0.98% | |
| Price / MAexp100: | +0.04% |
News
The last news published on INTERCONTINENTAL EXCHANGE INC. at the time of the generation of this analysis was as follows:
- Intercontinental Exchange Chair & CEO Jeffrey C. Sprecher to Present at the Goldman Sachs U.S. Financial Services Conference on December 5
- ICE First Look at Monthly Mortgage Performance: Delinquencies Rose in September While Foreclosure Activity Remained Muted
- Black Knight: As Home Prices Set Yet Another Record in August, Pushing Annual Growth Rate Sharply Higher, Small but Active Cash-Out Refinance Market Defies Traditional Analysis
- ICE Announces Record Trading Activity in Dubai and Murban Crude As Participants Utilize ICE’s Global Oil Complex to Manage Crude Flows
- Intercontinental Exchange, Black Knight and the Federal Trade Commission Jointly Agree to Dismiss Federal Court Case, Pending Settlement Negotiations
About author
Online


Add a comment
Comments
0 comments on the analysis INTERCONTINENTAL EXCHANGE INC. - 1H