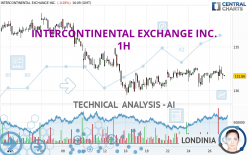
INTERCONTINENTAL EXCHANGE INC. - 1H - Technical analysis published on 04/29/2024 (GMT)
- 83
- 0
Click here for a new analysis!
- Timeframe : 1H
- - Analysis generated on
- Status : TARGET REACHED

Summary of the analysis

Additional analysis
Quotes
INTERCONTINENTAL EXCHANGE INC. rating 131.68 USD. The price registered a decrease of -0.02% on the session and was between 131.32 USD and 132.87 USD. This implies that the price is at +0.27% from its lowest and at -0.90% from its highest.The Central Gaps scanner detects a bearish opening. A small advantage for sellers in the very short term.
Bearish opening
Type : Bearish
Timeframe : Openning
So that you have an overall view of the price change, here is a table showing the variations over several periods:
Near a new HIGH record (1 month)
Type : Bullish
Timeframe : Weekly
Technical
Technical analysis of this 1H chart of INTERCONTINENTAL EXCHANGE INC. indicates that the overall trend is bearish. 75.00% of the signals given by moving averages are bearish. This bearish trend is slowing down slightly given the slightly bearish signals given by short-term moving averages. The Central Indicators market scanner is currently detecting several bearish signals that could impact this trend:
Bearish trend reversal : Moving Average 20
Type : Bearish
Timeframe : 1 hour
Bearish trend reversal : adaptative moving average 20
Type : Bearish
Timeframe : 1 hour
Bearish trend reversal : adaptative moving average 50
Type : Bearish
Timeframe : 1 hour
The technical indicators are generally neutral. They do not provide relevant information on the direction of future price movements.
Central Indicators, the detector scanner for these technical indicators has recently detected several signals:
RSI indicator is back under 50
Type : Bearish
Timeframe : 1 hour
MACD crosses DOWN its Moving Average
Type : Bearish
Timeframe : 1 hour
Price is back under the pivot point
Type : Bearish
Timeframe : Weekly
Momentum indicator is back under 0
Type : Bearish
Timeframe : 1 hour
Williams %R indicator is back under -50
Type : Bearish
Timeframe : 1 hour
An analysis of the price chart with the Central Patterns scanner (detector of chart patterns and resistances and supports) shows a result that can have an impact on the price change:
Support of channel is broken
Type : Bearish
Timeframe : 1 hour
The Central Candlesticks scanner, specialised in Japanese candlesticks, did not identify any signals.
| S3 | S2 | S1 | Price | R1 | R2 | R3 | |
|---|---|---|---|---|---|---|---|
| ProTrendLines | 112.22 | 117.20 | 129.90 | 131.68 | 132.65 | 134.52 | 136.03 |
| Change (%) | -14.78% | -11.00% | -1.35% | - | +0.74% | +2.16% | +3.30% |
| Change | -19.46 | -14.48 | -1.78 | - | +0.97 | +2.84 | +4.35 |
| Level | Intermediate | Major | Major | - | Intermediate | Major | Major |
Pivot points can also be used to set your price objectives. Here is the price situation in relation to pivot points:
| Pivot points | S3 | S2 | S1 | PP | R1 | R2 | R3 |
|---|---|---|---|---|---|---|---|
| Standard | 129.55 | 130.22 | 130.96 | 131.63 | 132.37 | 133.04 | 133.78 |
| Camarilla | 131.31 | 131.44 | 131.57 | 131.70 | 131.83 | 131.96 | 132.09 |
| Woodie | 129.59 | 130.24 | 131.00 | 131.65 | 132.41 | 133.06 | 133.82 |
| Fibonacci | 130.22 | 130.76 | 131.09 | 131.63 | 132.17 | 132.50 | 133.04 |
| Pivot points | S3 | S2 | S1 | PP | R1 | R2 | R3 |
|---|---|---|---|---|---|---|---|
| Standard | 128.32 | 129.37 | 130.54 | 131.59 | 132.76 | 133.81 | 134.98 |
| Camarilla | 131.09 | 131.29 | 131.50 | 131.70 | 131.90 | 132.11 | 132.31 |
| Woodie | 128.37 | 129.40 | 130.59 | 131.62 | 132.81 | 133.84 | 135.03 |
| Fibonacci | 129.37 | 130.22 | 130.75 | 131.59 | 132.44 | 132.97 | 133.81 |
| Pivot points | S3 | S2 | S1 | PP | R1 | R2 | R3 |
|---|---|---|---|---|---|---|---|
| Standard | 128.56 | 131.36 | 134.39 | 137.19 | 140.22 | 143.02 | 146.05 |
| Camarilla | 135.83 | 136.36 | 136.90 | 137.43 | 137.96 | 138.50 | 139.03 |
| Woodie | 128.69 | 131.42 | 134.52 | 137.25 | 140.35 | 143.08 | 146.18 |
| Fibonacci | 131.36 | 133.58 | 134.96 | 137.19 | 139.41 | 140.79 | 143.02 |
Numerical data
The following is the status of technical indicators and moving averages registered at the time this technical analysis was created:
| RSI (14): | 46.87 | |
| MACD (12,26,9): | 0.0500 | |
| Directional Movement: | -8.99 | |
| AROON (14): | 85.71 | |
| DEMA (21): | 131.97 | |
| Parabolic SAR (0,02-0,02-0,2): | 130.87 | |
| Elder Ray (13): | -0.28 | |
| Super Trend (3,10): | 132.59 | |
| Zig ZAG (10): | 131.73 | |
| VORTEX (21): | 0.9800 | |
| Stochastique (14,3,5): | 59.12 | |
| TEMA (21): | 131.99 | |
| Williams %R (14): | -59.09 | |
| Chande Momentum Oscillator (20): | -0.27 | |
| Repulse (5,40,3): | -0.1500 | |
| ROCnROLL: | 2 | |
| TRIX (15,9): | 0.0100 | |
| Courbe Coppock: | 0.38 |
| MA7: | 131.86 | |
| MA20: | 133.32 | |
| MA50: | 135.59 | |
| MA100: | 130.61 | |
| MAexp7: | 131.89 | |
| MAexp20: | 131.89 | |
| MAexp50: | 131.90 | |
| MAexp100: | 132.54 | |
| Price / MA7: | -0.14% | |
| Price / MA20: | -1.23% | |
| Price / MA50: | -2.88% | |
| Price / MA100: | +0.82% | |
| Price / MAexp7: | -0.16% | |
| Price / MAexp20: | -0.16% | |
| Price / MAexp50: | -0.17% | |
| Price / MAexp100: | -0.65% |
News
The last news published on INTERCONTINENTAL EXCHANGE INC. at the time of the generation of this analysis was as follows:
- Intercontinental Exchange Chair & CEO Jeffrey C. Sprecher to Present at the Goldman Sachs U.S. Financial Services Conference on December 5
- ICE First Look at Monthly Mortgage Performance: Delinquencies Rose in September While Foreclosure Activity Remained Muted
- Black Knight: As Home Prices Set Yet Another Record in August, Pushing Annual Growth Rate Sharply Higher, Small but Active Cash-Out Refinance Market Defies Traditional Analysis
- ICE Announces Record Trading Activity in Dubai and Murban Crude As Participants Utilize ICE’s Global Oil Complex to Manage Crude Flows
- Intercontinental Exchange, Black Knight and the Federal Trade Commission Jointly Agree to Dismiss Federal Court Case, Pending Settlement Negotiations
About author
Online


Add a comment
Comments
0 comments on the analysis INTERCONTINENTAL EXCHANGE INC. - 1H