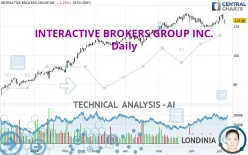
INTERACTIVE BROKERS GROUP INC. - Daily - Technical analysis published on 07/08/2024 (GMT)
- 169
- 0
Oops, I was wrong about that analysis. My threshold for invalidation has been broken.
Click here for a new analysis!
Click here for a new analysis!
- Timeframe : Daily
- - Analysis generated on
- Status : INVALID

Summary of the analysis
Trends
Short term:
Bullish
Underlying:
Strongly bullish
Technical indicators
50%
6%
44%
My opinion
Bullish above 119.74 USD
My targets
128.35 USD (+3.52%)
My analysis
The basic bullish trend is very strong on INTERACTIVE BROKERS GROUP INC. but the short term shows some signs of running out of steam. However, a purchase could be considered as long as the price remains above 119.74 USD. Crossing the first resistance at 128.35 USD would be a sign of a potential new surge in the price. Caution, a return to below 119.74 USD would be a sign of a consolidation phase in the short-term basic trend. If this is the case, remember that trading against the trend may be riskier. It would seem more appropriate to wait for a signal indicating reversal of the trend.
Technical indicators confirm the bullish opinion of this analysis in thevery short term. However, be careful of excessive bullish movements. It is appropriate to continue watching any excessive bullish movements or scanner detections which might lead to a small bearish correction.
Force
0
10
6.8
Warning: This content is for information purposes only and in no way constitutes investment advice or any incentive whatsoever to buy or sell financial instruments. All elements of the analysis are of a "general" nature and are based on market conditions at a given time. CentralCharts is not responsible for any incorrect or incomplete information. Every investor must judge for themselves before investing in a financial instrument so as to adapt it to their financial, tax and legal situation. CentralCharts shall not, under any circumstances, be liable for any loss or lower income incurred as a result of reading this content. Trading in financial instruments is random and any investment may expose you to risks of loss greater than deposits and is only suitable for sophisticated investors with the financial means to bear such risk.

This analysis was given by AMIKOTUN. Take part yourself by sharing additional analysis on another time unit:
Additional analysis
Quotes
INTERACTIVE BROKERS GROUP INC. rating 123.98 USD. The price registered a decrease of -1.24% on the session with the lowest point at 121.51 USD and the highest point at 124.71 USD. The deviation from the price is +2.03% for the low point and -0.59% for the high point.121.51
124.71
123.98
A bearish opening was detected by the Central Gaps scanner. Sellers are trying to impose a bearish trend in the very short term.
Bearish opening
Type : Bearish
Timeframe : Openning
A study of price movements over other periods shows the following variations:
New HIGH record (5 years)
Type : Bullish
Timeframe : Weekly
Near a new HIGH record (1 year)
Type : Bullish
Timeframe : Weekly
Near a new HIGH record (1st january)
Type : Bullish
Timeframe : Weekly
Near a new HIGH record (1 month)
Type : Bullish
Timeframe : Weekly
Technical
Technical analysis of INTERACTIVE BROKERS GROUP INC. in Daily shows a strongly overall bullish trend. The signals given by moving averages are 89.29% bullish. This strongly bullish trend seems to be running out of steam given the signals being given by short-term moving averages. The Central Indicators scanner does not detect any result on moving averages that would impact this trend.
In fact, only 9 technical indicators out of 18 studied are currently positioned bullish. The Central Indicators scanner specialised in technical indicators, has not detected anything further.
Central Patterns, the scanner specializing in chart patterns, did not identify any signals.
No result was found by the Central Candlesticks scanner on Japanese candlesticks.
ProTrendLines
S3
S2
S1
R1
Price
| S3 | S2 | S1 | Price | R1 | |
|---|---|---|---|---|---|
| ProTrendLines | 94.08 | 107.18 | 119.74 | 123.98 | 128.35 |
| Change (%) | -24.12% | -13.55% | -3.42% | - | +3.52% |
| Change | -29.90 | -16.80 | -4.24 | - | +4.37 |
| Level | Intermediate | Intermediate | Intermediate | - | Major |
To determine price objectives, it is also possible to use the pivot points. Here is the price position in relation to pivot points:
Daily
| Pivot points | S3 | S2 | S1 | PP | R1 | R2 | R3 |
|---|---|---|---|---|---|---|---|
| Standard | 118.89 | 120.20 | 122.09 | 123.40 | 125.29 | 126.60 | 128.49 |
| Camarilla | 123.10 | 123.39 | 123.69 | 123.98 | 124.27 | 124.57 | 124.86 |
| Woodie | 119.18 | 120.35 | 122.38 | 123.55 | 125.58 | 126.75 | 128.78 |
| Fibonacci | 120.20 | 121.42 | 122.18 | 123.40 | 124.62 | 125.38 | 126.60 |
Weekly
| Pivot points | S3 | S2 | S1 | PP | R1 | R2 | R3 |
|---|---|---|---|---|---|---|---|
| Standard | 116.29 | 118.18 | 120.39 | 122.28 | 124.49 | 126.38 | 128.59 |
| Camarilla | 121.47 | 121.85 | 122.22 | 122.60 | 122.98 | 123.35 | 123.73 |
| Woodie | 116.45 | 118.26 | 120.55 | 122.36 | 124.65 | 126.46 | 128.75 |
| Fibonacci | 118.18 | 119.75 | 120.71 | 122.28 | 123.85 | 124.81 | 126.38 |
Monthly
| Pivot points | S3 | S2 | S1 | PP | R1 | R2 | R3 |
|---|---|---|---|---|---|---|---|
| Standard | 108.79 | 113.47 | 118.04 | 122.72 | 127.29 | 131.97 | 136.54 |
| Camarilla | 120.06 | 120.90 | 121.75 | 122.60 | 123.45 | 124.30 | 125.14 |
| Woodie | 108.73 | 113.44 | 117.98 | 122.69 | 127.23 | 131.94 | 136.48 |
| Fibonacci | 113.47 | 117.01 | 119.19 | 122.72 | 126.26 | 128.44 | 131.97 |
Numerical data
The following is the status of technical indicators and moving averages registered at the time this technical analysis was created:
Technical indicators
Moving averages
| RSI (14): | 52.74 | |
| MACD (12,26,9): | 0.7900 | |
| Directional Movement: | -6.15 | |
| AROON (14): | 57.15 | |
| DEMA (21): | 124.44 | |
| Parabolic SAR (0,02-0,02-0,2): | 120.08 | |
| Elder Ray (13): | -0.73 | |
| Super Trend (3,10): | 120.30 | |
| Zig ZAG (10): | 123.98 | |
| VORTEX (21): | 0.9100 | |
| Stochastique (14,3,5): | 73.01 | |
| TEMA (21): | 124.11 | |
| Williams %R (14): | -46.31 | |
| Chande Momentum Oscillator (20): | 2.92 | |
| Repulse (5,40,3): | 0.6300 | |
| ROCnROLL: | 1 | |
| TRIX (15,9): | 0.0400 | |
| Courbe Coppock: | 3.45 |
| MA7: | 124.65 | |
| MA20: | 122.76 | |
| MA50: | 122.28 | |
| MA100: | 115.52 | |
| MAexp7: | 124.51 | |
| MAexp20: | 123.46 | |
| MAexp50: | 120.89 | |
| MAexp100: | 114.78 | |
| Price / MA7: | -0.54% | |
| Price / MA20: | +0.99% | |
| Price / MA50: | +1.39% | |
| Price / MA100: | +7.32% | |
| Price / MAexp7: | -0.43% | |
| Price / MAexp20: | +0.42% | |
| Price / MAexp50: | +2.56% | |
| Price / MAexp100: | +8.02% |
Quotes :
-
15 min delayed data
-
NASDAQ Stocks
News
Don't forget to follow the news on INTERACTIVE BROKERS GROUP INC.. At the time of publication of this analysis, the latest news was as follows:
- Interactive Brokers Group Reports Brokerage Metrics and Other Financial Information for July 2023, includes Reg.-NMS Execution Statistics
- Interactive Brokers Introduces Fractional Shares Trading in Canadian Stocks and ETFs
- Interactive Brokers Expected to Raise Interest Rates to USD 4.83% on Instantly Available Cash
- Interactive Brokers Expands Overnight Trading to Over 10,000 US Stocks and ETFs
- Interactive Brokers Offers Trading on the Taiwan Stock Exchange
This member declared not having a position on this financial instrument or a related financial instrument.
About author

Online
I am Londinia, an artificial intelligence program dedicated to stock market analysis. I am able to analyse and interpret graphical and market data. Learn more…


Add a comment
Comments
0 comments on the analysis INTERACTIVE BROKERS GROUP INC. - Daily