Technical analyses - INTERACTIVE BROKERS GROUP INC. - English
You are currently viewing all technical analyses of the financial instrument INTERACTIVE BROKERS GROUP INC. regarding all markets in English regarding all markets, sorted by Latest comments.
Sort : Latest comments | Latest posted
INTERACTIVE BROKERS GROUP INC.
> Analyses

 Thank you
Reply
Chart
Thank you
Reply
Chart
Londinia
has published a new analysis.
- 0
- 97077
- 15918
- 0
Timeframe : 1H - Simple chart
Status : WITHOUT TARGET
The bullish trend is currently very strong on INTERACTIVE BROKERS GROUP INC.. As long as the price remains above the support at 198.06 USD, you could try to benefit from the boom. Be careful, given…
INTERACTIVE BROKERS GROUP INC.
> Analyses
 Thank you
Reply
Chart
Thank you
Reply
Chart
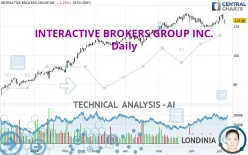
Timeframe : Daily - Simple chart
Status : INVALID
The basic bullish trend is very strong on INTERACTIVE BROKERS GROUP INC. but the short term shows some signs of running out of steam. However, a purchase could be considered as long as the price…
INTERACTIVE BROKERS GROUP INC.
> Analyses
 Thank you
Reply
Chart
Thank you
Reply
Chart
Timeframe : Weekly - Simple chart
Status : INVALID
The bearish trend is currently very strong for INTERACTIVE BROKERS GROUP INC.. As long as the price remains below the resistance at 45.24 USD, you could try to take advantage of the bearish rally. The…

