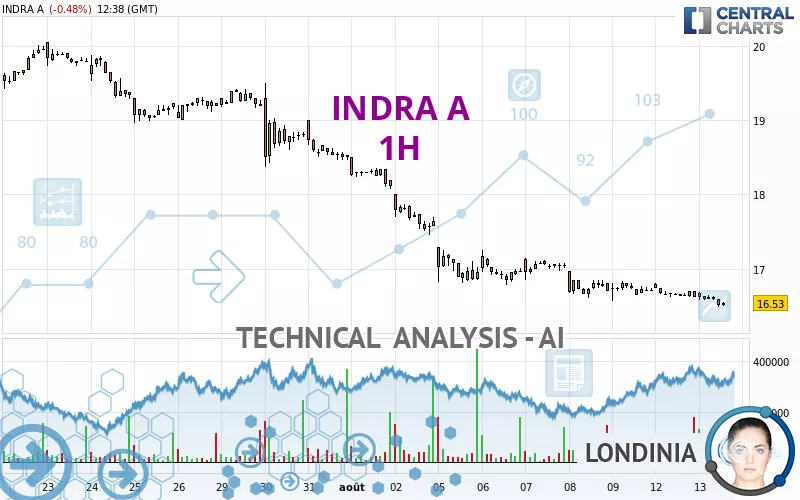
INDRA A - 1H - Technical analysis published on 08/13/2024 (GMT)
- 124
- 0
Click here for a new analysis!
- Timeframe : 1H
- - Analysis generated on
- Status : LEVEL MAINTAINED

Summary of the analysis

Additional analysis
Quotes
The INDRA A rating is 16.53 EUR. The price is lower by -0.48% since the last closing and was traded between 16.48 EUR and 16.68 EUR over the period. The price is currently at +0.30% from its lowest and -0.90% from its highest.The Central Gaps scanner detects a bullish opening. A small advantage for buyers in the very short term.
Bullish opening
Type : Bullish
Timeframe : Openning
A study of price movements over other periods shows the following variations:
New LOW record (1 month)
Type : Bearish
Timeframe : Weekly
Technical
Technical analysis of INDRA A in 1H shows a overall strongly bearish trend. 92.86% of the signals given by moving averages are bearish. The overall trend is supported by the strong bearish signals from short-term moving averages. The Central Indicators scanner does not detect any result on moving averages that would impact this trend.
In fact, 11 technical indicators on 18 studied are currently positioned bearish. Caution: the Central Indicators scanner currently detects an excess:
CCI indicator is oversold : under -100
Type : Neutral
Timeframe : 1 hour
Previous candle closed under Bollinger bands
Type : Neutral
Timeframe : 1 hour
MACD indicator: bullish divergence
Type : Bullish
Timeframe : 1 hour
Williams %R indicator is oversold : under -80
Type : Neutral
Timeframe : 1 hour
Pivot points : price is under support 1
Type : Neutral
Timeframe : 1 hour
MACD crosses DOWN its Moving Average
Type : Bearish
Timeframe : 1 hour
Central Patterns, the scanner specializing in chart patterns, did not identify any signals.
The Central Candlesticks scanner which studies Japanese candlesticks did not detect anything.
| S3 | S2 | S1 | Price | R1 | R2 | R3 | |
|---|---|---|---|---|---|---|---|
| ProTrendLines | 13.67 | 15.54 | 16.25 | 16.53 | 16.80 | 17.66 | 18.37 |
| Change (%) | -17.30% | -5.99% | -1.69% | - | +1.63% | +6.84% | +11.13% |
| Change | -2.86 | -0.99 | -0.28 | - | +0.27 | +1.13 | +1.84 |
| Level | Major | Minor | Minor | - | Intermediate | Major | Minor |
Attention could also be paid to pivot points to set price objectives:
| Pivot points | S3 | S2 | S1 | PP | R1 | R2 | R3 |
|---|---|---|---|---|---|---|---|
| Standard | 16.34 | 16.48 | 16.54 | 16.68 | 16.74 | 16.88 | 16.94 |
| Camarilla | 16.56 | 16.57 | 16.59 | 16.61 | 16.63 | 16.65 | 16.67 |
| Woodie | 16.31 | 16.46 | 16.51 | 16.66 | 16.71 | 16.86 | 16.91 |
| Fibonacci | 16.48 | 16.55 | 16.60 | 16.68 | 16.75 | 16.80 | 16.88 |
| Pivot points | S3 | S2 | S1 | PP | R1 | R2 | R3 |
|---|---|---|---|---|---|---|---|
| Standard | 15.69 | 16.12 | 16.42 | 16.85 | 17.15 | 17.58 | 17.88 |
| Camarilla | 16.51 | 16.58 | 16.64 | 16.71 | 16.78 | 16.84 | 16.91 |
| Woodie | 15.62 | 16.09 | 16.35 | 16.82 | 17.08 | 17.55 | 17.81 |
| Fibonacci | 16.12 | 16.40 | 16.57 | 16.85 | 17.13 | 17.30 | 17.58 |
| Pivot points | S3 | S2 | S1 | PP | R1 | R2 | R3 |
|---|---|---|---|---|---|---|---|
| Standard | 16.23 | 17.30 | 17.92 | 18.99 | 19.61 | 20.68 | 21.30 |
| Camarilla | 18.08 | 18.23 | 18.39 | 18.54 | 18.70 | 18.85 | 19.01 |
| Woodie | 16.01 | 17.19 | 17.70 | 18.88 | 19.39 | 20.57 | 21.08 |
| Fibonacci | 17.30 | 17.95 | 18.34 | 18.99 | 19.64 | 20.03 | 20.68 |
Numerical data
The following are the details of the technical indicators and moving averages that were collected to generate this technical analysis:
| RSI (14): | 38.14 | |
| MACD (12,26,9): | -0.0700 | |
| Directional Movement: | -17.73 | |
| AROON (14): | -92.86 | |
| DEMA (21): | 16.54 | |
| Parabolic SAR (0,02-0,02-0,2): | 16.78 | |
| Elder Ray (13): | -0.09 | |
| Super Trend (3,10): | 16.75 | |
| Zig ZAG (10): | 16.54 | |
| VORTEX (21): | 0.8000 | |
| Stochastique (14,3,5): | 13.81 | |
| TEMA (21): | 16.57 | |
| Williams %R (14): | -76.00 | |
| Chande Momentum Oscillator (20): | -0.12 | |
| Repulse (5,40,3): | -0.2800 | |
| ROCnROLL: | 2 | |
| TRIX (15,9): | -0.0600 | |
| Courbe Coppock: | 1.45 |
| MA7: | 16.79 | |
| MA20: | 18.32 | |
| MA50: | 19.19 | |
| MA100: | 19.13 | |
| MAexp7: | 16.58 | |
| MAexp20: | 16.65 | |
| MAexp50: | 16.89 | |
| MAexp100: | 17.38 | |
| Price / MA7: | -1.55% | |
| Price / MA20: | -9.77% | |
| Price / MA50: | -13.86% | |
| Price / MA100: | -13.59% | |
| Price / MAexp7: | -0.30% | |
| Price / MAexp20: | -0.72% | |
| Price / MAexp50: | -2.13% | |
| Price / MAexp100: | -4.89% |
News
The latest news and videos published on INDRA A at the time of the analysis were as follows:
-
 Indra Nooyi: 'Women represent an awesome talent pool'
- Novo Integrated Sciences Appoints Dr. Indrajit (Indra) Sinha Ph.D. as Chief Science Officer
- Indra Is About To Take The Plunge In Paris And Revolutionise Transport Payments In The French Capital
- GomSpace has been chosen to develop advanced satellites for global air traffic management by Indra and Enaira's Startical consortium
-
Pepsi CEO Indra Nooyi Eyed As World Bank Head
About author
Online


Add a comment
Comments
0 comments on the analysis INDRA A - 1H