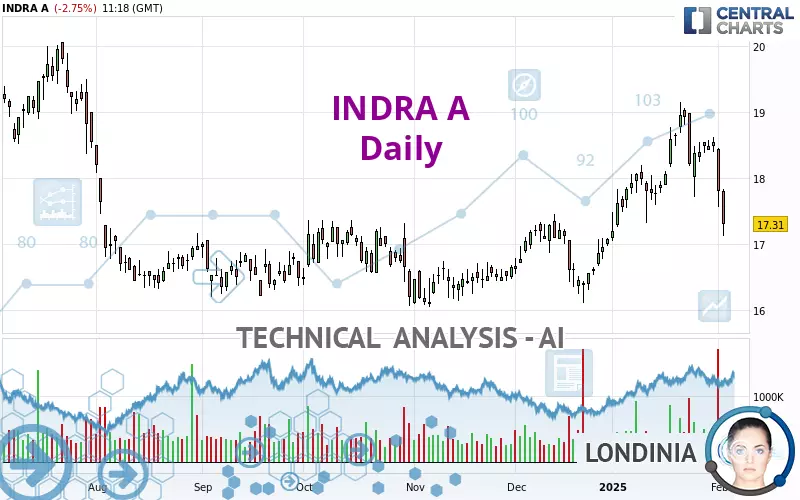
INDRA A - Daily - Technical analysis published on 02/04/2025 (GMT)
- 151
- 0
Click here for a new analysis!
- Timeframe : Daily
- - Analysis generated on
- Status : INVALID

Summary of the analysis

Additional analysis
Quotes
INDRA A rating 17.31 EUR. On the day, this instrument lost -2.75% with the lowest point at 17.12 EUR and the highest point at 17.83 EUR. The deviation from the price is +1.11% for the low point and -2.92% for the high point.The Central Gaps scanner detects a bullish opening marking the presence of buyers ahead of sellers at the opening but not sufficiently marked to allow the price to register a quotation gap.
Bullish opening
Type : Bullish
Timeframe : Openning
A study of price movements over other periods shows the following variations:
Near a new LOW record (1st january)
Type : Bearish
Timeframe : Weekly
New LOW record (1 month)
Type : Bearish
Timeframe : Weekly
Technical
A technical analysis in Daily of this INDRA A chart shows a neutral trend. The strong bearish signals currently being given by short-term moving averages could allow the overall trend to return to a bearish trend. The Central Indicators scanner detects bearish signals on moving averages that could impact this trend:
Bearish trend reversal : adaptative moving average 20
Type : Bearish
Timeframe : Daily
Bearish price crossover with Moving Average 50
Type : Bearish
Timeframe : Daily
Bearish price crossover with adaptative moving average 100
Type : Bearish
Timeframe : Daily
In fact, 11 technical indicators on 18 studied are currently positioned bearish. Caution: the Central Indicators scanner currently detects an excess:
CCI indicator is oversold : under -100
Type : Neutral
Timeframe : Daily
Williams %R indicator is oversold : under -80
Type : Neutral
Timeframe : Daily
Pivot points : price is under support 1
Type : Neutral
Timeframe : Daily
Pivot points : price is under support 3
Type : Neutral
Timeframe : Weekly
Central Patterns, the market scanner focusing on chart patterns, resistances and supports found these results:
Horizontal support is broken
Type : Bearish
Timeframe : Daily
Support of channel is broken
Type : Bearish
Timeframe : Daily
No result was found by the Central Candlesticks scanner on Japanese candlesticks.
| S3 | S2 | S1 | Price | R1 | R2 | R3 | |
|---|---|---|---|---|---|---|---|
| ProTrendLines | 13.67 | 16.15 | 17.27 | 17.31 | 17.78 | 18.21 | 18.96 |
| Change (%) | -21.03% | -6.70% | -0.23% | - | +2.72% | +5.20% | +9.53% |
| Change | -3.64 | -1.16 | -0.04 | - | +0.47 | +0.90 | +1.65 |
| Level | Major | Major | Major | - | Intermediate | Intermediate | Intermediate |
To determine price objectives, it is also possible to use the pivot points. Here is the price position in relation to pivot points:
| Pivot points | S3 | S2 | S1 | PP | R1 | R2 | R3 |
|---|---|---|---|---|---|---|---|
| Standard | 16.55 | 17.06 | 17.43 | 17.94 | 18.31 | 18.82 | 19.19 |
| Camarilla | 17.56 | 17.64 | 17.72 | 17.80 | 17.88 | 17.96 | 18.04 |
| Woodie | 16.48 | 17.03 | 17.36 | 17.91 | 18.24 | 18.79 | 19.12 |
| Fibonacci | 17.06 | 17.40 | 17.60 | 17.94 | 18.28 | 18.48 | 18.82 |
| Pivot points | S3 | S2 | S1 | PP | R1 | R2 | R3 |
|---|---|---|---|---|---|---|---|
| Standard | 17.06 | 17.38 | 17.97 | 18.29 | 18.88 | 19.20 | 19.79 |
| Camarilla | 18.30 | 18.38 | 18.47 | 18.55 | 18.63 | 18.72 | 18.80 |
| Woodie | 17.19 | 17.45 | 18.10 | 18.36 | 19.01 | 19.27 | 19.92 |
| Fibonacci | 17.38 | 17.73 | 17.95 | 18.29 | 18.64 | 18.86 | 19.20 |
| Pivot points | S3 | S2 | S1 | PP | R1 | R2 | R3 |
|---|---|---|---|---|---|---|---|
| Standard | 15.25 | 16.15 | 17.35 | 18.25 | 19.45 | 20.35 | 21.55 |
| Camarilla | 17.97 | 18.17 | 18.36 | 18.55 | 18.74 | 18.94 | 19.13 |
| Woodie | 15.40 | 16.23 | 17.50 | 18.33 | 19.60 | 20.43 | 21.70 |
| Fibonacci | 16.15 | 16.95 | 17.45 | 18.25 | 19.05 | 19.55 | 20.35 |
Numerical data
The following is the status of technical indicators and moving averages registered at the time this technical analysis was created:
| RSI (14): | 38.50 | |
| MACD (12,26,9): | 0.1700 | |
| Directional Movement: | -17.83 | |
| AROON (14): | -64.29 | |
| DEMA (21): | 18.33 | |
| Parabolic SAR (0,02-0,02-0,2): | 18.79 | |
| Elder Ray (13): | -0.64 | |
| Super Trend (3,10): | 18.83 | |
| Zig ZAG (10): | 17.23 | |
| VORTEX (21): | 0.9200 | |
| Stochastique (14,3,5): | 27.34 | |
| TEMA (21): | 18.24 | |
| Williams %R (14): | -94.58 | |
| Chande Momentum Oscillator (20): | -0.83 | |
| Repulse (5,40,3): | -6.8700 | |
| ROCnROLL: | 2 | |
| TRIX (15,9): | 0.2800 | |
| Courbe Coppock: | 2.36 |
| MA7: | 18.17 | |
| MA20: | 18.19 | |
| MA50: | 17.43 | |
| MA100: | 17.05 | |
| MAexp7: | 18.03 | |
| MAexp20: | 18.04 | |
| MAexp50: | 17.62 | |
| MAexp100: | 17.41 | |
| Price / MA7: | -4.73% | |
| Price / MA20: | -4.84% | |
| Price / MA50: | -0.69% | |
| Price / MA100: | +1.52% | |
| Price / MAexp7: | -3.99% | |
| Price / MAexp20: | -4.05% | |
| Price / MAexp50: | -1.76% | |
| Price / MAexp100: | -0.57% |
News
The latest news and videos published on INDRA A at the time of the analysis were as follows:
- Indra Selected to Deploy Its Most Innovative Traffic and Tolling Technology on Atlanta’s SR 400 Express Lanes
-
 Indra Nooyi: 'Women represent an awesome talent pool'
- Novo Integrated Sciences Appoints Dr. Indrajit (Indra) Sinha Ph.D. as Chief Science Officer
- Indra Is About To Take The Plunge In Paris And Revolutionise Transport Payments In The French Capital
- GomSpace has been chosen to develop advanced satellites for global air traffic management by Indra and Enaira's Startical consortium
About author
Online


Add a comment
Comments
0 comments on the analysis INDRA A - Daily