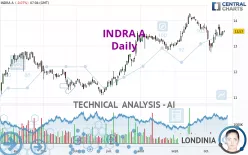
INDRA A - Daily - Technical analysis published on 10/18/2023 (GMT)
- 269
- 0
Click here for a new analysis!
- Timeframe : Daily
- - Analysis generated on
- Status : TARGET REACHED

Summary of the analysis

Additional analysis
Quotes
INDRA A rating 13.57 EUR. The price is lower by -0.07% since the last closing and was traded between 13.54 EUR and 13.62 EUR over the period. The price is currently at +0.22% from its lowest and -0.37% from its highest.The Central Gaps scanner detects a bearish opening. A small advantage for sellers in the very short term.
Bearish opening
Type : Bearish
Timeframe : Openning
Here is a more detailed summary of the historical variations registered by INDRA A:
Near a new LOW record (1 month)
Type : Bearish
Timeframe : Weekly
Technical
Technical analysis of this Daily chart of INDRA A indicates that the overall trend is strongly bullish. 82.14% of the signals given by moving averages are bullish. The slightly bullish signals given by the short-term moving averages show a weakening of the global trend. An assessment of moving averages reveals several bullish signals that could impact this trend:
Bullish price crossover with Moving Average 20
Type : Bullish
Timeframe : Daily
Bullish price crossover with Moving Average 50
Type : Bullish
Timeframe : Daily
In fact, according to the parameters integrated into the Central Analyzer system, only 9 technical indicators out of 18 analysed are currently bullish. But beware of excesses. The Central Indicators scanner currently detects this:
MACD indicator: bullish divergence
Type : Bullish
Timeframe : Daily
Pivot points : price is over resistance 1
Type : Neutral
Timeframe : Daily
RSI indicator is back over 50
Type : Bullish
Timeframe : Daily
MACD indicator is back over 0
Type : Bullish
Timeframe : Daily
Central Patterns, the scanner specializing in chart patterns, did not identify any signals.
The Central Candlesticks scanner, specialised in Japanese candlesticks, did not identify any signals.
| S3 | S2 | S1 | Price | R1 | R2 | |
|---|---|---|---|---|---|---|
| ProTrendLines | 11.44 | 12.52 | 13.50 | 13.57 | 13.85 | 14.15 |
| Change (%) | -15.70% | -7.74% | -0.52% | - | +2.06% | +4.27% |
| Change | -2.13 | -1.05 | -0.07 | - | +0.28 | +0.58 |
| Level | Minor | Major | Intermediate | - | Major | Major |
To determine price objectives, it is also possible to use the pivot points. Here is the price position in relation to pivot points:
| Pivot points | S3 | S2 | S1 | PP | R1 | R2 | R3 |
|---|---|---|---|---|---|---|---|
| Standard | 13.28 | 13.35 | 13.46 | 13.53 | 13.64 | 13.71 | 13.82 |
| Camarilla | 13.53 | 13.55 | 13.56 | 13.58 | 13.60 | 13.61 | 13.63 |
| Woodie | 13.31 | 13.36 | 13.49 | 13.54 | 13.67 | 13.72 | 13.85 |
| Fibonacci | 13.35 | 13.42 | 13.46 | 13.53 | 13.60 | 13.64 | 13.71 |
| Pivot points | S3 | S2 | S1 | PP | R1 | R2 | R3 |
|---|---|---|---|---|---|---|---|
| Standard | 12.39 | 12.76 | 13.10 | 13.47 | 13.81 | 14.18 | 14.52 |
| Camarilla | 13.25 | 13.31 | 13.38 | 13.44 | 13.51 | 13.57 | 13.64 |
| Woodie | 12.38 | 12.75 | 13.09 | 13.46 | 13.80 | 14.17 | 14.51 |
| Fibonacci | 12.76 | 13.03 | 13.20 | 13.47 | 13.74 | 13.91 | 14.18 |
| Pivot points | S3 | S2 | S1 | PP | R1 | R2 | R3 |
|---|---|---|---|---|---|---|---|
| Standard | 11.78 | 12.40 | 13.05 | 13.67 | 14.32 | 14.94 | 15.59 |
| Camarilla | 13.35 | 13.47 | 13.58 | 13.70 | 13.82 | 13.93 | 14.05 |
| Woodie | 11.80 | 12.41 | 13.07 | 13.68 | 14.34 | 14.95 | 15.61 |
| Fibonacci | 12.40 | 12.89 | 13.19 | 13.67 | 14.16 | 14.46 | 14.94 |
Numerical data
The following are the details of the technical indicators and moving averages that were collected to generate this technical analysis:
| RSI (14): | 52.56 | |
| MACD (12,26,9): | -0.0100 | |
| Directional Movement: | -1.65 | |
| AROON (14): | -28.57 | |
| DEMA (21): | 13.52 | |
| Parabolic SAR (0,02-0,02-0,2): | 12.91 | |
| Elder Ray (13): | 0.01 | |
| Super Trend (3,10): | 12.95 | |
| Zig ZAG (10): | 13.58 | |
| VORTEX (21): | 0.8400 | |
| Stochastique (14,3,5): | 64.90 | |
| TEMA (21): | 13.40 | |
| Williams %R (14): | -26.55 | |
| Chande Momentum Oscillator (20): | -0.12 | |
| Repulse (5,40,3): | -0.1700 | |
| ROCnROLL: | 1 | |
| TRIX (15,9): | 0.0000 | |
| Courbe Coppock: | 5.26 |
| MA7: | 13.51 | |
| MA20: | 13.57 | |
| MA50: | 13.44 | |
| MA100: | 12.66 | |
| MAexp7: | 13.49 | |
| MAexp20: | 13.51 | |
| MAexp50: | 13.33 | |
| MAexp100: | 12.86 | |
| Price / MA7: | +0.44% | |
| Price / MA20: | -0% | |
| Price / MA50: | +0.97% | |
| Price / MA100: | +7.19% | |
| Price / MAexp7: | +0.59% | |
| Price / MAexp20: | +0.44% | |
| Price / MAexp50: | +1.80% | |
| Price / MAexp100: | +5.52% |
News
Don't forget to follow the news on INDRA A. At the time of publication of this analysis, the latest news was as follows:
-
 Indra Nooyi: 'Women represent an awesome talent pool'
- Novo Integrated Sciences Appoints Dr. Indrajit (Indra) Sinha Ph.D. as Chief Science Officer
- Indra Is About To Take The Plunge In Paris And Revolutionise Transport Payments In The French Capital
- GomSpace has been chosen to develop advanced satellites for global air traffic management by Indra and Enaira's Startical consortium
-
Pepsi CEO Indra Nooyi Eyed As World Bank Head
About author
Online


Add a comment
Comments
0 comments on the analysis INDRA A - Daily