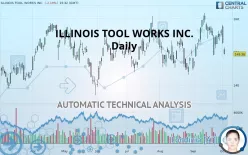
ILLINOIS TOOL WORKS INC. - Daily - Technical analysis published on 10/02/2019 (GMT)
- 283
- 0
- Who voted?
Click here for a new analysis!
- Timeframe : Daily
- - Analysis generated on
- Status : INVALID

Summary of the analysis

Additional analysis
Quotes
The ILLINOIS TOOL WORKS INC. rating is 149.38 USD. The price registered a decrease of -2.19% on the session with the lowest point at 149.20 USD and the highest point at 151.37 USD. The deviation from the price is +0.12% for the low point and -1.31% for the high point.The Central Gaps scanner detects the formation of a bearish gap marking the strong presence of sellers ahead of buyers at the opening. This formed a quotation gap.
Opening Gap DOWN
Type : Bearish
Timeframe : Openning
Here is a more detailed summary of the historical variations registered by ILLINOIS TOOL WORKS INC.:
Near a new LOW record (1 month)
Type : Bearish
Timeframe : Weekly
Technical
A technical analysis in Daily of this ILLINOIS TOOL WORKS INC. chart shows a slightly bearish trend. Only 53.57% of the signals given by moving averages are bearish. This slightly bearish trend is not supported by the signals currently being given by short-term moving averages. The Central Indicators market scanner is currently detecting several bearish signals that could impact this trend:
Bearish trend reversal : adaptative moving average 20
Type : Bearish
Timeframe : Daily
Bearish price crossover with Moving Average 20
Type : Bearish
Timeframe : Daily
In fact, Central Analyzer took into account 18 technical indicators and the result was as follows: 4 are bullish, 6 are neutral and 8 are bearish. Central Indicators, the detector scanner for these technical indicators has recently detected several signals:
Pivot points : price is under support 1
Type : Neutral
Timeframe : Daily
RSI indicator is back under 50
Type : Bearish
Timeframe : Daily
Parabolic SAR indicator bullish reversal
Type : Bullish
Timeframe : Daily
Price is back over the pivot point
Type : Bullish
Timeframe : Weekly
Williams %R indicator is back under -50
Type : Bearish
Timeframe : Daily
An analysis of the price chart with the Central Patterns scanner (detector of chart patterns and resistances and supports) shows a result that can have an impact on the price change:
Near support of channel
Type : Bullish
Timeframe : Daily
Central Candlesticks, the scanner specialised in Japanese candlesticks, detects a bearish signal that could support the hypothesis of a small drop in the very short term:
Bearish engulfing lines
Type : Bearish
Timeframe : Daily
| S3 | S2 | S1 | Price | R1 | R2 | R3 | |
|---|---|---|---|---|---|---|---|
| ProTrendLines | 119.09 | 139.61 | 145.10 | 149.38 | 150.18 | 158.62 | 170.96 |
| Change (%) | -20.28% | -6.54% | -2.87% | - | +0.54% | +6.19% | +14.45% |
| Change | -30.29 | -9.77 | -4.28 | - | +0.80 | +9.24 | +21.58 |
| Level | Major | Major | Major | - | Major | Major | Minor |
Attention could also be paid to pivot points to set price objectives:
| Pivot points | S3 | S2 | S1 | PP | R1 | R2 | R3 |
|---|---|---|---|---|---|---|---|
| Standard | 144.76 | 148.50 | 150.62 | 154.36 | 156.48 | 160.22 | 162.34 |
| Camarilla | 151.12 | 151.66 | 152.19 | 152.73 | 153.27 | 153.80 | 154.34 |
| Woodie | 143.94 | 148.10 | 149.80 | 153.96 | 155.66 | 159.82 | 161.52 |
| Fibonacci | 148.50 | 150.74 | 152.13 | 154.36 | 156.60 | 157.99 | 160.22 |
| Pivot points | S3 | S2 | S1 | PP | R1 | R2 | R3 |
|---|---|---|---|---|---|---|---|
| Standard | 142.15 | 145.06 | 149.47 | 152.38 | 156.79 | 159.70 | 164.11 |
| Camarilla | 151.86 | 152.53 | 153.20 | 153.87 | 154.54 | 155.21 | 155.89 |
| Woodie | 142.89 | 145.43 | 150.21 | 152.75 | 157.53 | 160.07 | 164.85 |
| Fibonacci | 145.06 | 147.86 | 149.58 | 152.38 | 155.18 | 156.90 | 159.70 |
| Pivot points | S3 | S2 | S1 | PP | R1 | R2 | R3 |
|---|---|---|---|---|---|---|---|
| Standard | 129.37 | 136.44 | 146.46 | 153.53 | 163.56 | 170.62 | 180.65 |
| Camarilla | 151.79 | 153.36 | 154.92 | 156.49 | 158.06 | 159.62 | 161.19 |
| Woodie | 130.85 | 137.18 | 147.94 | 154.27 | 165.04 | 171.36 | 182.13 |
| Fibonacci | 136.44 | 142.97 | 147.00 | 153.53 | 160.06 | 164.09 | 170.62 |
Numerical data
The following is the status of technical indicators and moving averages registered at the time this technical analysis was created:
| RSI (14): | 43.97 | |
| MACD (12,26,9): | 0.6400 | |
| Directional Movement: | -11.41 | |
| AROON (14): | -42.86 | |
| DEMA (21): | 154.25 | |
| Parabolic SAR (0,02-0,02-0,2): | 148.18 | |
| Elder Ray (13): | -3.01 | |
| Super Trend (3,10): | 149.36 | |
| Zig ZAG (10): | 149.88 | |
| VORTEX (21): | 1.0500 | |
| Stochastique (14,3,5): | 39.35 | |
| TEMA (21): | 153.99 | |
| Williams %R (14): | -86.48 | |
| Chande Momentum Oscillator (20): | -5.80 | |
| Repulse (5,40,3): | -2.7400 | |
| ROCnROLL: | 2 | |
| TRIX (15,9): | 0.1200 | |
| Courbe Coppock: | 2.04 |
| MA7: | 153.29 | |
| MA20: | 154.51 | |
| MA50: | 151.40 | |
| MA100: | 149.38 | |
| MAexp7: | 153.14 | |
| MAexp20: | 153.18 | |
| MAexp50: | 151.66 | |
| MAexp100: | 149.61 | |
| Price / MA7: | -2.55% | |
| Price / MA20: | -3.32% | |
| Price / MA50: | -1.33% | |
| Price / MA100: | -0% | |
| Price / MAexp7: | -2.46% | |
| Price / MAexp20: | -2.48% | |
| Price / MAexp50: | -1.50% | |
| Price / MAexp100: | -0.15% |
News
The last news published on ILLINOIS TOOL WORKS INC. at the time of the generation of this analysis was as follows:
- Report: Exploring Fundamental Drivers Behind Sarepta Therapeutics, Reinsurance Group of America, Illinois Tool Works, ATN International, Morningstar, and Hubbell — New Horizons, Emerging Trends, and Upcoming Developments
- New Research: Key Drivers of Growth for Illinois Tool Works, Aircastle, TriState Capital, Blueprint Medicines, MGE Energy, and Cubic — Factors of Influence, Major Initiatives and Sustained Production
- Detailed Research: Economic Perspectives on NeoGenomics, Illinois Tool Works, Carriage Services, Gorman-Rupp, Fiesta Restaurant Group, and American Financial Group — What Drives Growth in Today's Competitive Landscape
- Report: Developing Opportunities within Watts Water Technologies, Anixter International, CareTrust REIT, Spartan Motors, Electro Scientific Industries, and Illinois Tool Works — Future Expectations, Projections Moving into 2018
-
 Illinois Tool Works CEO: Innovation Focus | Mad Money | CNBC
About author

Online


Add a comment
Comments
0 comments on the analysis ILLINOIS TOOL WORKS INC. - Daily