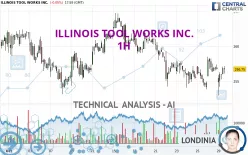
ILLINOIS TOOL WORKS INC. - 1H - Technical analysis published on 10/29/2024 (GMT)
- 150
- 0
Click here for a new analysis!
- Timeframe : 1H
- - Analysis generated on
- Status : INVALID

Summary of the analysis

Additional analysis
Quotes
ILLINOIS TOOL WORKS INC. rating 256.75 USD. The price is lower by -0.05% since the last closing and was between 253.00 USD and 257.19 USD. This implies that the price is at +1.48% from its lowest and at -0.17% from its highest.A bearish gap was detected at the opening by the Central Gaps scanner. There are a lot of sellers and they have the upper hand in the very short term.
Opening Gap DOWN
Type : Bearish
Timeframe : Openning
So that you have an overall view of the price change, here is a table showing the variations over several periods:
Near a new HIGH record (5 years)
Type : Bullish
Timeframe : Weekly
Near a new HIGH record (1 year)
Type : Bullish
Timeframe : Weekly
Near a new HIGH record (1st january)
Type : Bullish
Timeframe : Weekly
Near a new HIGH record (1 month)
Type : Bullish
Timeframe : Weekly
New LOW record (1 month)
Type : Bearish
Timeframe : Weekly
Technical
A technical analysis in 1H of this ILLINOIS TOOL WORKS INC. chart shows a bearish trend. 71.43% of the signals given by moving averages are bearish. Caution: the neutral signals currently given by short-term moving averages show us that the global trend is losing momentum. An assessment of moving averages reveals several bearish and bullish signals:
Bullish trend reversal : adaptative moving average 20
Type : Bullish
Timeframe : 1 hour
Bearish price crossover with adaptative moving average 20
Type : Bearish
Timeframe : 1 hour
In fact, according to the parameters integrated into the Central Analyzer system, 11 technical indicators out of 18 analysed are currently bullish. No additional result has been identified by Central Indicators, the scanner specialised in technical indicators.
The Central Patterns scanner, which studies chart patterns, resistances and supports, has identified these signals:
Near resistance of channel
Type : Bearish
Timeframe : 1 hour
Near resistance of triangle
Type : Bearish
Timeframe : 1 hour
The Central Candlesticks scanner which studies Japanese candlesticks did not detect anything.
| S3 | S2 | S1 | Price | R1 | R2 | R3 | |
|---|---|---|---|---|---|---|---|
| ProTrendLines | 252.45 | 253.85 | 255.98 | 256.75 | 258.56 | 261.42 | 265.80 |
| Change (%) | -1.67% | -1.13% | -0.30% | - | +0.70% | +1.82% | +3.52% |
| Change | -4.30 | -2.90 | -0.77 | - | +1.81 | +4.67 | +9.05 |
| Level | Intermediate | Major | Major | - | Intermediate | Major | Major |
Attention could also be paid to pivot points to set price objectives:
| Pivot points | S3 | S2 | S1 | PP | R1 | R2 | R3 |
|---|---|---|---|---|---|---|---|
| Standard | 252.75 | 254.24 | 255.55 | 257.04 | 258.35 | 259.84 | 261.15 |
| Camarilla | 256.10 | 256.36 | 256.61 | 256.87 | 257.13 | 257.38 | 257.64 |
| Woodie | 252.67 | 254.20 | 255.47 | 257.00 | 258.27 | 259.80 | 261.07 |
| Fibonacci | 254.24 | 255.31 | 255.97 | 257.04 | 258.11 | 258.77 | 259.84 |
| Pivot points | S3 | S2 | S1 | PP | R1 | R2 | R3 |
|---|---|---|---|---|---|---|---|
| Standard | 244.41 | 249.12 | 251.60 | 256.31 | 258.79 | 263.50 | 265.98 |
| Camarilla | 252.10 | 252.76 | 253.42 | 254.08 | 254.74 | 255.40 | 256.06 |
| Woodie | 243.30 | 248.56 | 250.49 | 255.75 | 257.68 | 262.94 | 264.87 |
| Fibonacci | 249.12 | 251.87 | 253.56 | 256.31 | 259.06 | 260.75 | 263.50 |
| Pivot points | S3 | S2 | S1 | PP | R1 | R2 | R3 |
|---|---|---|---|---|---|---|---|
| Standard | 219.51 | 229.66 | 245.87 | 256.02 | 272.23 | 282.38 | 298.59 |
| Camarilla | 254.82 | 257.24 | 259.65 | 262.07 | 264.49 | 266.90 | 269.32 |
| Woodie | 222.53 | 231.18 | 248.89 | 257.54 | 275.25 | 283.90 | 301.61 |
| Fibonacci | 229.66 | 239.73 | 245.95 | 256.02 | 266.09 | 272.31 | 282.38 |
Numerical data
The following is the status of the technical indicators and moving averages at the time of publication of this technical analysis:
| RSI (14): | 50.24 | |
| MACD (12,26,9): | -0.1200 | |
| Directional Movement: | -4.27 | |
| AROON (14): | -50.00 | |
| DEMA (21): | 256.10 | |
| Parabolic SAR (0,02-0,02-0,2): | 258.09 | |
| Elder Ray (13): | 0.50 | |
| Super Trend (3,10): | 253.37 | |
| Zig ZAG (10): | 256.51 | |
| VORTEX (21): | 0.9600 | |
| Stochastique (14,3,5): | 62.71 | |
| TEMA (21): | 256.46 | |
| Williams %R (14): | -36.32 | |
| Chande Momentum Oscillator (20): | 2.37 | |
| Repulse (5,40,3): | 0.2800 | |
| ROCnROLL: | -1 | |
| TRIX (15,9): | -0.0100 | |
| Courbe Coppock: | 0.54 |
| MA7: | 256.38 | |
| MA20: | 258.37 | |
| MA50: | 253.61 | |
| MA100: | 246.39 | |
| MAexp7: | 256.37 | |
| MAexp20: | 256.35 | |
| MAexp50: | 257.04 | |
| MAexp100: | 257.55 | |
| Price / MA7: | +0.14% | |
| Price / MA20: | -0.63% | |
| Price / MA50: | +1.24% | |
| Price / MA100: | +4.20% | |
| Price / MAexp7: | +0.15% | |
| Price / MAexp20: | +0.16% | |
| Price / MAexp50: | -0.11% | |
| Price / MAexp100: | -0.31% |
News
The last news published on ILLINOIS TOOL WORKS INC. at the time of the generation of this analysis was as follows:
- Report: Exploring Fundamental Drivers Behind Sarepta Therapeutics, Reinsurance Group of America, Illinois Tool Works, ATN International, Morningstar, and Hubbell — New Horizons, Emerging Trends, and Upcoming Developments
- New Research: Key Drivers of Growth for Illinois Tool Works, Aircastle, TriState Capital, Blueprint Medicines, MGE Energy, and Cubic — Factors of Influence, Major Initiatives and Sustained Production
- Detailed Research: Economic Perspectives on NeoGenomics, Illinois Tool Works, Carriage Services, Gorman-Rupp, Fiesta Restaurant Group, and American Financial Group — What Drives Growth in Today's Competitive Landscape
- Report: Developing Opportunities within Watts Water Technologies, Anixter International, CareTrust REIT, Spartan Motors, Electro Scientific Industries, and Illinois Tool Works — Future Expectations, Projections Moving into 2018
-
 Illinois Tool Works CEO: Innovation Focus | Mad Money | CNBC
About author
Online


Add a comment
Comments
0 comments on the analysis ILLINOIS TOOL WORKS INC. - 1H