ILLINOIS TOOL WORKS INC. - 1H - Technical analysis published on 04/03/2024 (GMT)
- 196
- 0
Click here for a new analysis!
- Timeframe : 1H
- - Analysis generated on
- Status : INVALID

Summary of the analysis

Additional analysis
Quotes
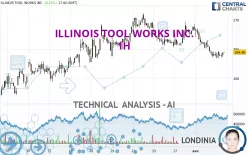
The ILLINOIS TOOL WORKS INC. price is 263.87 USD. The price is lower by -0.02% since the last closing and was traded between 263.42 USD and 264.67 USD over the period. The price is currently at +0.17% from its lowest and -0.30% from its highest.The Central Gaps scanner detects a bearish gap which is a sign that the sellers have taken the lead in the very short term.
Opening Gap DOWN
Type : Bearish
Timeframe : Openning
So that you have an overall view of the price change, here is a table showing the variations over several periods:
Near a new HIGH record (5 years)
Type : Bullish
Timeframe : Weekly
Near a new HIGH record (1 year)
Type : Bullish
Timeframe : Weekly
Near a new HIGH record (1st january)
Type : Bullish
Timeframe : Weekly
Near a new LOW record (1 month)
Type : Bearish
Timeframe : Weekly
Technical
Technical analysis of ILLINOIS TOOL WORKS INC. in 1H shows an overall bearish trend. The signals given by moving averages are 71.43% bearish. This bearish trend is reinforced by the strong signals currently being given by short-term moving averages. The Central Indicators market scanner currently does not detect any result that concerns moving averages.
In fact, of the 18 technical indicators analysed by Central Analyzer, 5 are bullish, 3 are neutral and 10 are bearish. Caution: the Central Indicators scanner currently detects an excess:
Williams %R indicator is oversold : under -80
Type : Neutral
Timeframe : 1 hour
Pivot points : price is under support 1
Type : Neutral
Timeframe : Weekly
The Central Patterns scanner, which studies chart patterns, resistances and supports, has identified this signal:
Near resistance of channel
Type : Bearish
Timeframe : 1 hour
The Central Candlesticks scanner, specialised in Japanese candlesticks, did not identify any signals.
| S3 | S2 | S1 | Price | R1 | R2 | R3 | |
|---|---|---|---|---|---|---|---|
| ProTrendLines | 257.26 | 258.97 | 262.32 | 263.87 | 264.41 | 265.73 | 268.91 |
| Change (%) | -2.51% | -1.86% | -0.59% | - | +0.20% | +0.70% | +1.91% |
| Change | -6.61 | -4.90 | -1.55 | - | +0.54 | +1.86 | +5.04 |
| Level | Minor | Major | Major | - | Major | Minor | Major |
Attention could also be paid to pivot points to set price objectives:
| Pivot points | S3 | S2 | S1 | PP | R1 | R2 | R3 |
|---|---|---|---|---|---|---|---|
| Standard | 259.86 | 261.72 | 262.83 | 264.69 | 265.80 | 267.66 | 268.77 |
| Camarilla | 263.11 | 263.39 | 263.66 | 263.93 | 264.20 | 264.48 | 264.75 |
| Woodie | 259.48 | 261.53 | 262.45 | 264.50 | 265.42 | 267.47 | 268.39 |
| Fibonacci | 261.72 | 262.86 | 263.56 | 264.69 | 265.83 | 266.53 | 267.66 |
| Pivot points | S3 | S2 | S1 | PP | R1 | R2 | R3 |
|---|---|---|---|---|---|---|---|
| Standard | 259.10 | 261.49 | 264.91 | 267.30 | 270.72 | 273.11 | 276.53 |
| Camarilla | 266.73 | 267.27 | 267.80 | 268.33 | 268.86 | 269.40 | 269.93 |
| Woodie | 259.62 | 261.75 | 265.43 | 267.56 | 271.24 | 273.37 | 277.05 |
| Fibonacci | 261.49 | 263.71 | 265.08 | 267.30 | 269.52 | 270.89 | 273.11 |
| Pivot points | S3 | S2 | S1 | PP | R1 | R2 | R3 |
|---|---|---|---|---|---|---|---|
| Standard | 240.38 | 246.52 | 257.43 | 263.57 | 274.48 | 280.62 | 291.53 |
| Camarilla | 263.64 | 265.20 | 266.77 | 268.33 | 269.89 | 271.46 | 273.02 |
| Woodie | 242.76 | 247.71 | 259.81 | 264.76 | 276.86 | 281.81 | 293.91 |
| Fibonacci | 246.52 | 253.04 | 257.06 | 263.57 | 270.09 | 274.11 | 280.62 |
Numerical data
The following is the status of technical indicators and moving averages registered at the time this technical analysis was created:
| RSI (14): | 33.16 | |
| MACD (12,26,9): | -0.7600 | |
| Directional Movement: | -11.20 | |
| AROON (14): | -50.00 | |
| DEMA (21): | 264.07 | |
| Parabolic SAR (0,02-0,02-0,2): | 264.47 | |
| Elder Ray (13): | -0.72 | |
| Super Trend (3,10): | 266.36 | |
| Zig ZAG (10): | 263.80 | |
| VORTEX (21): | 0.8000 | |
| Stochastique (14,3,5): | 14.17 | |
| TEMA (21): | 263.46 | |
| Williams %R (14): | -87.89 | |
| Chande Momentum Oscillator (20): | -1.33 | |
| Repulse (5,40,3): | -0.0900 | |
| ROCnROLL: | 2 | |
| TRIX (15,9): | -0.0300 | |
| Courbe Coppock: | 2.08 |
| MA7: | 265.44 | |
| MA20: | 264.05 | |
| MA50: | 259.79 | |
| MA100: | 253.66 | |
| MAexp7: | 264.09 | |
| MAexp20: | 264.96 | |
| MAexp50: | 265.52 | |
| MAexp100: | 264.73 | |
| Price / MA7: | -0.59% | |
| Price / MA20: | -0.07% | |
| Price / MA50: | +1.57% | |
| Price / MA100: | +4.03% | |
| Price / MAexp7: | -0.08% | |
| Price / MAexp20: | -0.41% | |
| Price / MAexp50: | -0.62% | |
| Price / MAexp100: | -0.32% |
News
The latest news and videos published on ILLINOIS TOOL WORKS INC. at the time of the analysis were as follows:
- Report: Exploring Fundamental Drivers Behind Sarepta Therapeutics, Reinsurance Group of America, Illinois Tool Works, ATN International, Morningstar, and Hubbell — New Horizons, Emerging Trends, and Upcoming Developments
- New Research: Key Drivers of Growth for Illinois Tool Works, Aircastle, TriState Capital, Blueprint Medicines, MGE Energy, and Cubic — Factors of Influence, Major Initiatives and Sustained Production
- Detailed Research: Economic Perspectives on NeoGenomics, Illinois Tool Works, Carriage Services, Gorman-Rupp, Fiesta Restaurant Group, and American Financial Group — What Drives Growth in Today's Competitive Landscape
- Report: Developing Opportunities within Watts Water Technologies, Anixter International, CareTrust REIT, Spartan Motors, Electro Scientific Industries, and Illinois Tool Works — Future Expectations, Projections Moving into 2018
-
 Illinois Tool Works CEO: Innovation Focus | Mad Money | CNBC
About author
Online


Add a comment
Comments
0 comments on the analysis ILLINOIS TOOL WORKS INC. - 1H