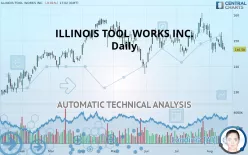
ILLINOIS TOOL WORKS INC. - Daily - Technical analysis published on 08/15/2019 (GMT)
- 377
- 0
Click here for a new analysis!
- Timeframe : Daily
- - Analysis generated on
- Status : TARGET REACHED

Summary of the analysis

Additional analysis
Quotes
The ILLINOIS TOOL WORKS INC. rating is 146.58 USD. The price is lower by -0.01% since the last closing and was between 146.19 USD and 147.73 USD. This implies that the price is at +0.27% from its lowest and at -0.78% from its highest.The Central Gaps scanner detects a bullish opening marking the presence of buyers ahead of sellers at the opening but not sufficiently marked to allow the price to register a quotation gap.
Bullish opening
Type : Bullish
Timeframe : Openning
A study of price movements over other periods shows the following variations:
Near a new LOW record (1 month)
Type : Bearish
Timeframe : Weekly
Technical
Technical analysis of this Daily chart of ILLINOIS TOOL WORKS INC. indicates that the overall trend is slightly bearish. Only 53.57% of the signals given by moving averages are bearish. This slightly bearish trend is reinforced by the strong signals currently being given by short-term moving averages. The Central Indicators scanner detects bearish signals on moving averages that could impact this trend:
Bearish price crossover with Moving Average 50
Type : Bearish
Timeframe : Daily
Bearish price crossover with Moving Average 100
Type : Bearish
Timeframe : Daily
Bearish price crossover with adaptative moving average 20
Type : Bearish
Timeframe : Daily
Bearish price crossover with adaptative moving average 50
Type : Bearish
Timeframe : Daily
Bearish price crossover with adaptative moving average 100
Type : Bearish
Timeframe : Daily
In fact, according to the parameters integrated into the Central Analyzer system, 10 technical indicators out of 18 analysed are currently bearish. But beware of excesses. The Central Indicators scanner currently detects this:
Williams %R indicator is oversold : under -80
Type : Neutral
Timeframe : Daily
RSI indicator is back under 50
Type : Bearish
Timeframe : Daily
Price is back under the pivot point
Type : Bearish
Timeframe : Daily
Central Patterns, the market scanner focusing on chart patterns, resistances and supports found this result:
Near support of channel
Type : Bullish
Timeframe : Daily
The Central Candlesticks scanner which studies Japanese candlesticks did not detect anything.
| S3 | S2 | S1 | Price | R1 | R2 | R3 | |
|---|---|---|---|---|---|---|---|
| ProTrendLines | 129.80 | 139.61 | 146.21 | 146.58 | 150.18 | 158.41 | 170.96 |
| Change (%) | -11.45% | -4.76% | -0.25% | - | +2.46% | +8.07% | +16.63% |
| Change | -16.78 | -6.97 | -0.37 | - | +3.60 | +11.83 | +24.38 |
| Level | Minor | Major | Major | - | Major | Major | Minor |
Pivot points can also be used to set your price objectives. Here is the price situation in relation to pivot points:
| Pivot points | S3 | S2 | S1 | PP | R1 | R2 | R3 |
|---|---|---|---|---|---|---|---|
| Standard | 141.96 | 144.27 | 145.43 | 147.74 | 148.90 | 151.21 | 152.37 |
| Camarilla | 145.64 | 145.95 | 146.27 | 146.59 | 146.91 | 147.23 | 147.54 |
| Woodie | 141.39 | 143.98 | 144.86 | 147.45 | 148.33 | 150.92 | 151.80 |
| Fibonacci | 144.27 | 145.60 | 146.41 | 147.74 | 149.07 | 149.88 | 151.21 |
| Pivot points | S3 | S2 | S1 | PP | R1 | R2 | R3 |
|---|---|---|---|---|---|---|---|
| Standard | 140.02 | 142.68 | 146.11 | 148.77 | 152.20 | 154.86 | 158.29 |
| Camarilla | 147.86 | 148.41 | 148.97 | 149.53 | 150.09 | 150.65 | 151.21 |
| Woodie | 140.40 | 142.87 | 146.49 | 148.96 | 152.58 | 155.05 | 158.67 |
| Fibonacci | 142.68 | 145.01 | 146.45 | 148.77 | 151.10 | 152.54 | 154.86 |
| Pivot points | S3 | S2 | S1 | PP | R1 | R2 | R3 |
|---|---|---|---|---|---|---|---|
| Standard | 128.13 | 135.97 | 145.10 | 152.94 | 162.07 | 169.91 | 179.04 |
| Camarilla | 149.56 | 151.12 | 152.67 | 154.23 | 155.79 | 157.34 | 158.90 |
| Woodie | 128.78 | 136.29 | 145.75 | 153.26 | 162.72 | 170.23 | 179.69 |
| Fibonacci | 135.97 | 142.45 | 146.46 | 152.94 | 159.42 | 163.43 | 169.91 |
Numerical data
The following are the details of the technical indicators and moving averages that were collected to generate this technical analysis:
| RSI (14): | 41.91 | |
| MACD (12,26,9): | -0.8500 | |
| Directional Movement: | -0.84 | |
| AROON (14): | -42.86 | |
| DEMA (21): | 149.60 | |
| Parabolic SAR (0,02-0,02-0,2): | 145.67 | |
| Elder Ray (13): | -2.78 | |
| Super Trend (3,10): | 157.76 | |
| Zig ZAG (10): | 146.53 | |
| VORTEX (21): | 0.8500 | |
| Stochastique (14,3,5): | 21.23 | |
| TEMA (21): | 148.24 | |
| Williams %R (14): | -89.27 | |
| Chande Momentum Oscillator (20): | -9.31 | |
| Repulse (5,40,3): | -1.0600 | |
| ROCnROLL: | 2 | |
| TRIX (15,9): | 0.0000 | |
| Courbe Coppock: | 8.59 |
| MA7: | 148.92 | |
| MA20: | 152.00 | |
| MA50: | 150.50 | |
| MA100: | 149.98 | |
| MAexp7: | 148.71 | |
| MAexp20: | 150.30 | |
| MAexp50: | 150.15 | |
| MAexp100: | 148.17 | |
| Price / MA7: | -1.57% | |
| Price / MA20: | -3.57% | |
| Price / MA50: | -2.60% | |
| Price / MA100: | -2.27% | |
| Price / MAexp7: | -1.43% | |
| Price / MAexp20: | -2.48% | |
| Price / MAexp50: | -2.38% | |
| Price / MAexp100: | -1.07% |
News
The last news published on ILLINOIS TOOL WORKS INC. at the time of the generation of this analysis was as follows:
- Report: Exploring Fundamental Drivers Behind Sarepta Therapeutics, Reinsurance Group of America, Illinois Tool Works, ATN International, Morningstar, and Hubbell — New Horizons, Emerging Trends, and Upcoming Developments
- New Research: Key Drivers of Growth for Illinois Tool Works, Aircastle, TriState Capital, Blueprint Medicines, MGE Energy, and Cubic — Factors of Influence, Major Initiatives and Sustained Production
- Detailed Research: Economic Perspectives on NeoGenomics, Illinois Tool Works, Carriage Services, Gorman-Rupp, Fiesta Restaurant Group, and American Financial Group — What Drives Growth in Today's Competitive Landscape
- Report: Developing Opportunities within Watts Water Technologies, Anixter International, CareTrust REIT, Spartan Motors, Electro Scientific Industries, and Illinois Tool Works — Future Expectations, Projections Moving into 2018
-
 Illinois Tool Works CEO: Innovation Focus | Mad Money | CNBC
About author

Online


Add a comment
Comments
0 comments on the analysis ILLINOIS TOOL WORKS INC. - Daily