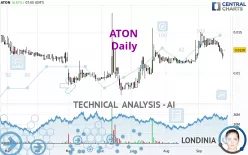
ATON - Daily - Technical analysis published on 09/25/2024 (GMT)
- 114
- 0
Click here for a new analysis!
- Timeframe : Daily
- - Analysis generated on
- Status : TARGET REACHED

Summary of the analysis

Additional analysis
Quotes
The ATON price is 0.0128 EUR. On the day, this instrument gained +6.67% and was traded between 0.0128 EUR and 0.0128 EUR over the period. The price is currently at 0% from its lowest and 0% from its highest.The Central Gaps scanner detects a bullish opening. A small advantage for buyers in the very short term.
Bullish opening
Type : Bullish
Timeframe : Openning
So that you have an overall view of the price change, here is a table showing the variations over several periods:
Near a new LOW record (1 month)
Type : Bearish
Timeframe : Weekly
Technical
A technical analysis in Daily of this ATON chart shows a bullish trend. 71.43% of the signals given by moving averages are bullish. Caution: the neutral signals currently given by the short-term moving averages indicate that this bullish trend is showing signs of running out of steam. The Central Indicators scanner detects bullish signals on moving averages that could impact this trend:
Bullish price crossover with Moving Average 50
Type : Bullish
Timeframe : Daily
Bullish price crossover with adaptative moving average 20
Type : Bullish
Timeframe : Daily
In fact, only 9 technical indicators out of 18 studied are currently bearish. Caution: the Central Indicators scanner currently detects an excess:
Previous candle closed under Bollinger bands
Type : Neutral
Timeframe : Daily
Pivot points : price is over resistance 1
Type : Neutral
Timeframe : Daily
RSI indicator is back over 50
Type : Bullish
Timeframe : Daily
Ichimoku : price is over the cloud
Type : Bullish
Timeframe : Daily
The analysis of the price chart with Central Patterns scanners does not return any result.
There is also a Japanese candlestick pattern detected by Central Candlesticks that could mark the end of the current short-term trend:
Doji
Type : Neutral
Timeframe : Daily
| S2 | S1 | Price | R1 | R2 | R3 | |
|---|---|---|---|---|---|---|
| ProTrendLines | 0.0087 | 0.0116 | 0.0128 | 0.0173 | 0.0225 | 0.0265 |
| Change (%) | -32.03% | -9.38% | - | +35.16% | +75.78% | +107.03% |
| Change | -0.0041 | -0.0012 | - | +0.0045 | +0.0097 | +0.0137 |
| Level | Intermediate | Major | - | Minor | Minor | Minor |
Pivot points can also be used to set your price objectives. Here is the price situation in relation to pivot points:
| Pivot points | S3 | S2 | S1 | PP | R1 | R2 | R3 |
|---|---|---|---|---|---|---|---|
| Standard | 0.0103 | 0.0110 | 0.0115 | 0.0122 | 0.0127 | 0.0134 | 0.0139 |
| Camarilla | 0.0117 | 0.0118 | 0.0119 | 0.0120 | 0.0121 | 0.0122 | 0.0123 |
| Woodie | 0.0102 | 0.0110 | 0.0114 | 0.0122 | 0.0126 | 0.0134 | 0.0138 |
| Fibonacci | 0.0110 | 0.0115 | 0.0117 | 0.0122 | 0.0127 | 0.0129 | 0.0134 |
| Pivot points | S3 | S2 | S1 | PP | R1 | R2 | R3 |
|---|---|---|---|---|---|---|---|
| Standard | 0.0105 | 0.0116 | 0.0121 | 0.0132 | 0.0137 | 0.0148 | 0.0153 |
| Camarilla | 0.0123 | 0.0124 | 0.0126 | 0.0127 | 0.0129 | 0.0130 | 0.0131 |
| Woodie | 0.0103 | 0.0115 | 0.0119 | 0.0131 | 0.0135 | 0.0147 | 0.0151 |
| Fibonacci | 0.0116 | 0.0122 | 0.0126 | 0.0132 | 0.0138 | 0.0142 | 0.0148 |
| Pivot points | S3 | S2 | S1 | PP | R1 | R2 | R3 |
|---|---|---|---|---|---|---|---|
| Standard | 0.0083 | 0.0097 | 0.0111 | 0.0125 | 0.0139 | 0.0153 | 0.0167 |
| Camarilla | 0.0116 | 0.0119 | 0.0121 | 0.0124 | 0.0127 | 0.0129 | 0.0132 |
| Woodie | 0.0082 | 0.0097 | 0.0110 | 0.0125 | 0.0138 | 0.0153 | 0.0166 |
| Fibonacci | 0.0097 | 0.0108 | 0.0115 | 0.0125 | 0.0136 | 0.0143 | 0.0153 |
Numerical data
The following is the status of technical indicators and moving averages registered at the time this technical analysis was created:
| RSI (14): | 50.24 | |
| MACD (12,26,9): | 0.0002 | |
| Directional Movement: | -0.8709 | |
| AROON (14): | -92.8571 | |
| DEMA (21): | 0.0133 | |
| Parabolic SAR (0,02-0,02-0,2): | 0.0154 | |
| Elder Ray (13): | -0.0002 | |
| Super Trend (3,10): | 0.0114 | |
| Zig ZAG (10): | 0.0128 | |
| VORTEX (21): | 1.0000 | |
| Stochastique (14,3,5): | 26.00 | |
| TEMA (21): | 0.0130 | |
| Williams %R (14): | -60.71 | |
| Chande Momentum Oscillator (20): | -0.0012 | |
| Repulse (5,40,3): | -5.2504 | |
| ROCnROLL: | -1 | |
| TRIX (15,9): | 0.4889 | |
| Courbe Coppock: | 5.37 |
| MA7: | 0.0130 | |
| MA20: | 0.0133 | |
| MA50: | 0.0122 | |
| MA100: | 0.0109 | |
| MAexp7: | 0.0129 | |
| MAexp20: | 0.0129 | |
| MAexp50: | 0.0123 | |
| MAexp100: | 0.0124 | |
| Price / MA7: | -1.54% | |
| Price / MA20: | -3.76% | |
| Price / MA50: | +4.92% | |
| Price / MA100: | +17.43% | |
| Price / MAexp7: | -0.78% | |
| Price / MAexp20: | -0.78% | |
| Price / MAexp50: | +4.07% | |
| Price / MAexp100: | +3.23% |
News
The last news published on ATON at the time of the generation of this analysis was as follows:
- Aton Announces Bridge Loan
- Aton Reports the Results From Its Phase 2 Diamond Drilling Programme at the Semna Gold Mine, Including 11.69 g/t Au and 1.38% Cu over an Interval of 5.19 metres
- Aton Reports New Surface Sampling Results From the Retained Exploration Areas at Abu Marawat, Including 183 g/t Au From Bohlog, 125 g/t Au From Semna, and 67.4 g/t Au From Kab Amira
-
 Hybrigenics
About author
Online


Add a comment
Comments
0 comments on the analysis ATON - Daily